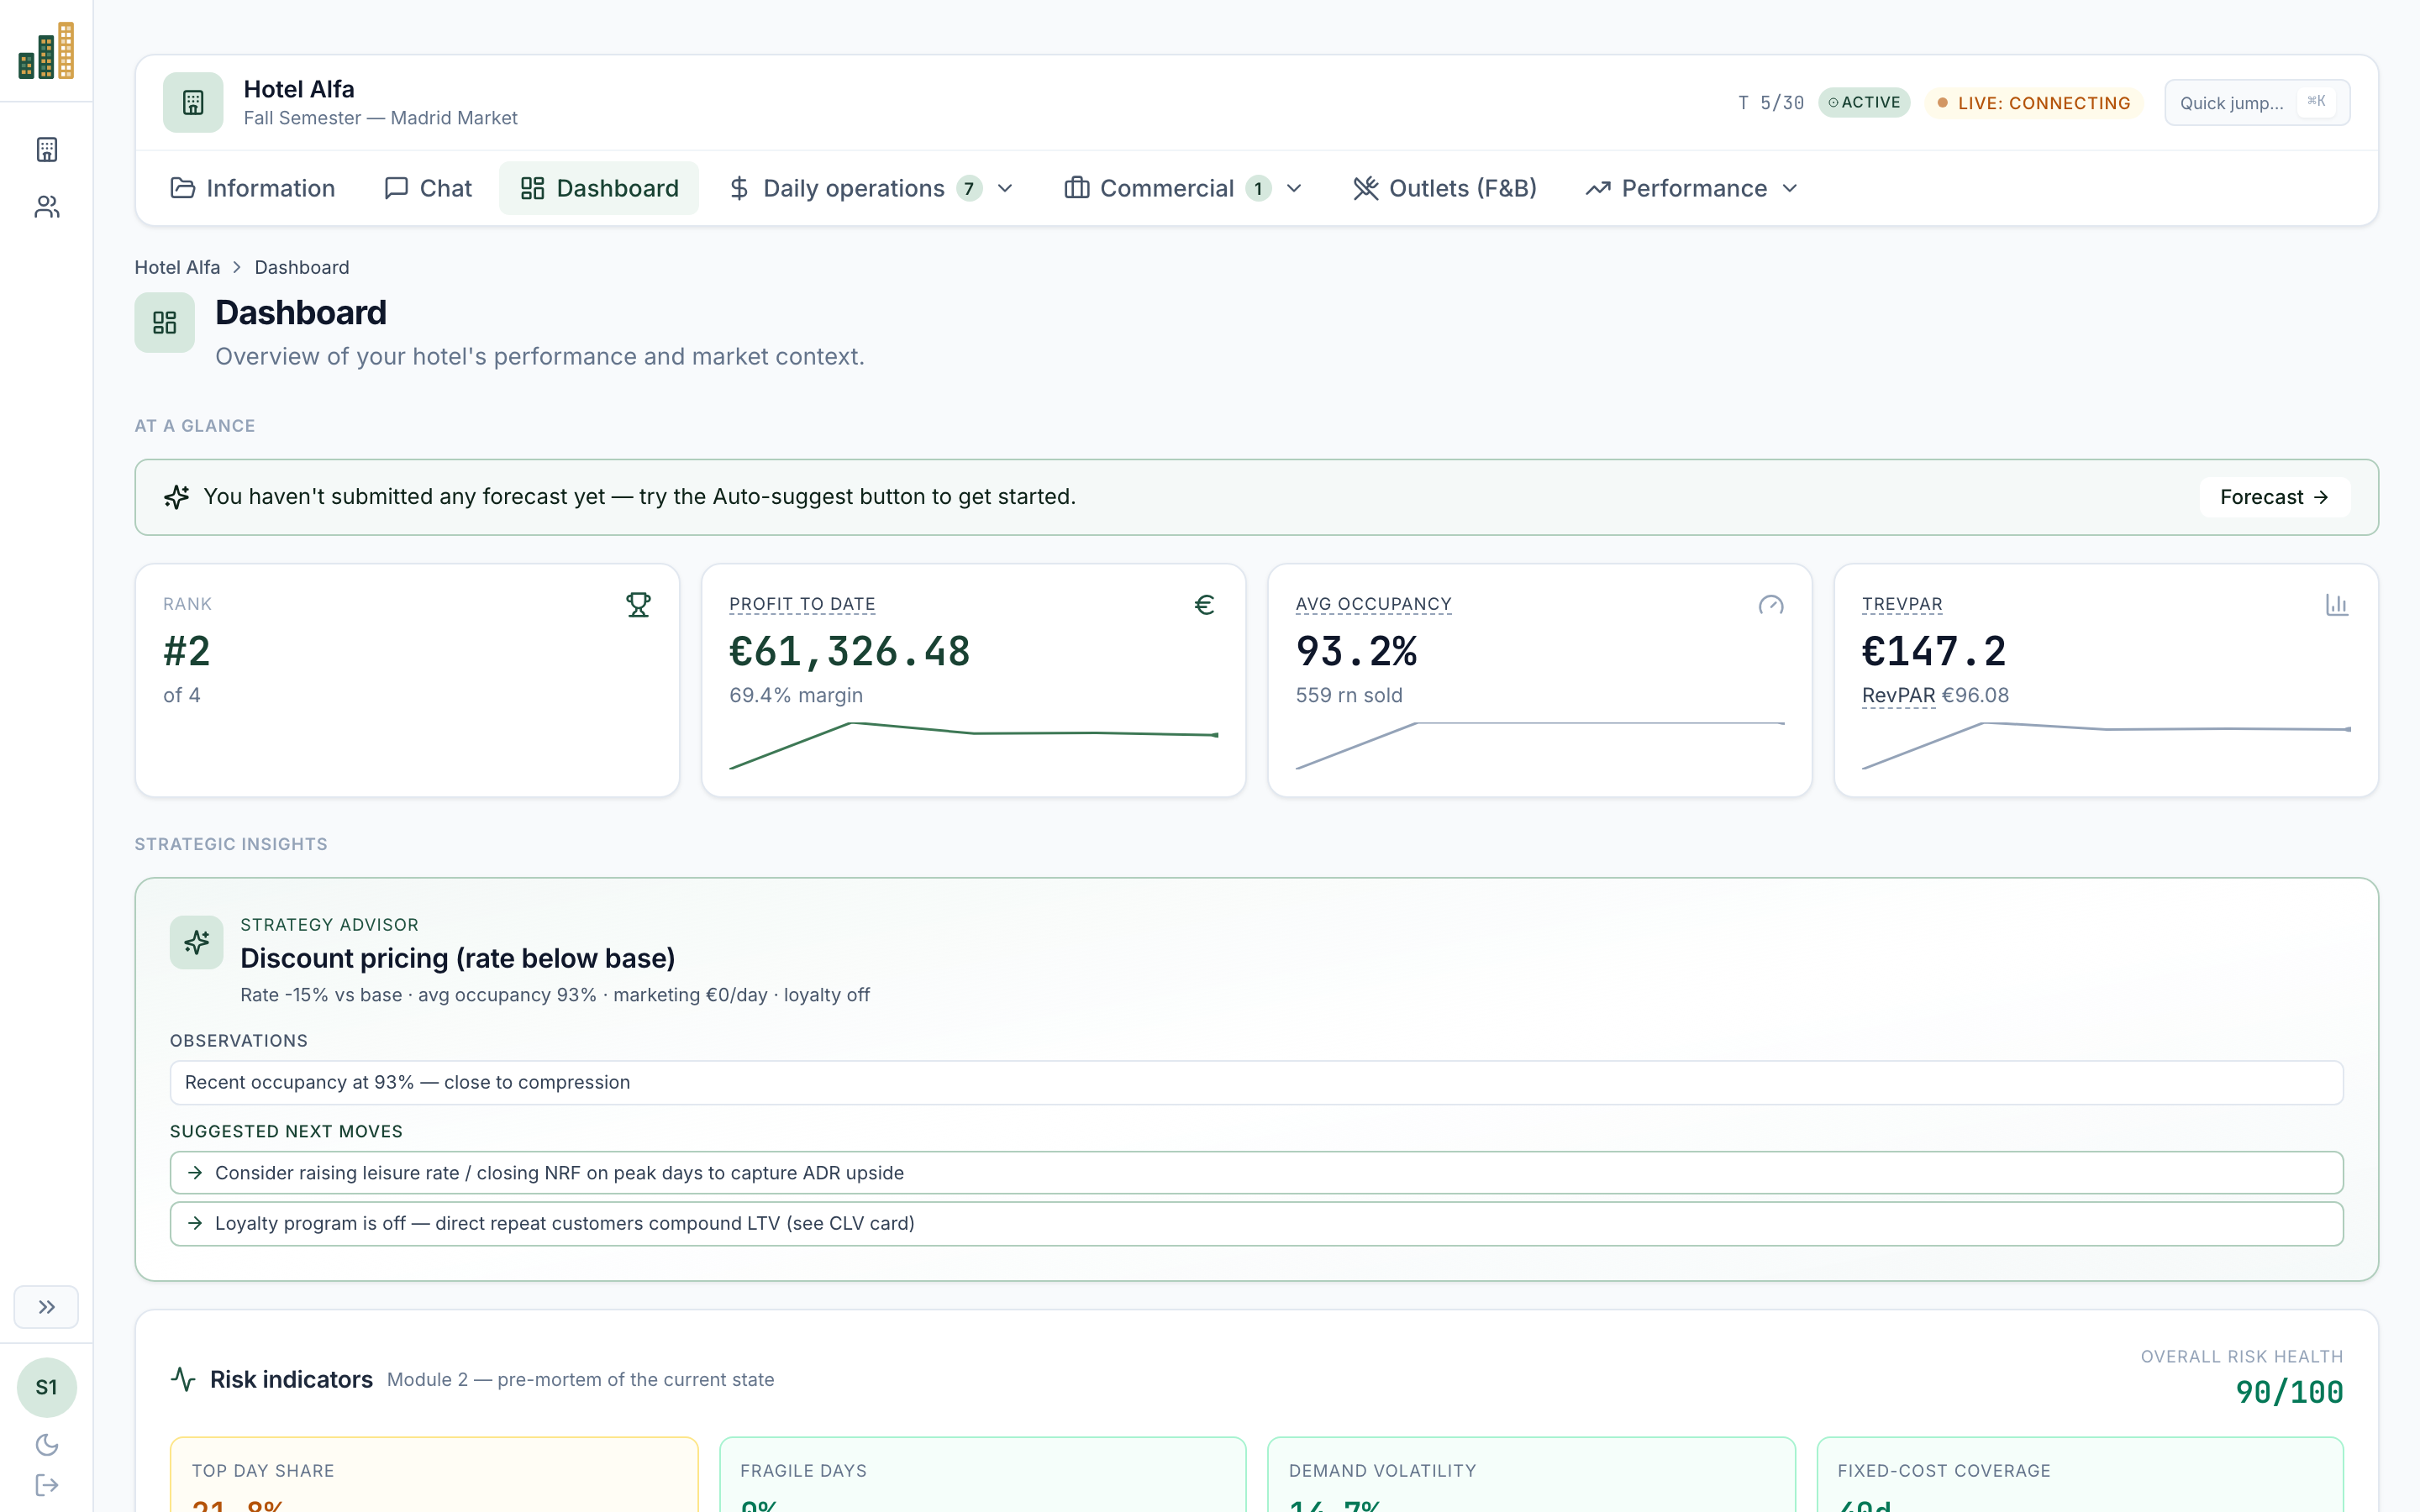
Dashboard
A morning briefing in fifteen seconds.
Rank vs. competitors, profit to date, occupancy, TRevPAR, plus a strategic advisor that surfaces the next move worth taking. Risk indicators at the bottom warn the student when occupancy is brittle, when pricing has drifted below base, when fixed cost coverage is thin.
- · Live competitive ranking, with delta vs market
- · Strategic advisor with suggested next moves
- · Risk indicator panel for early warnings before damage
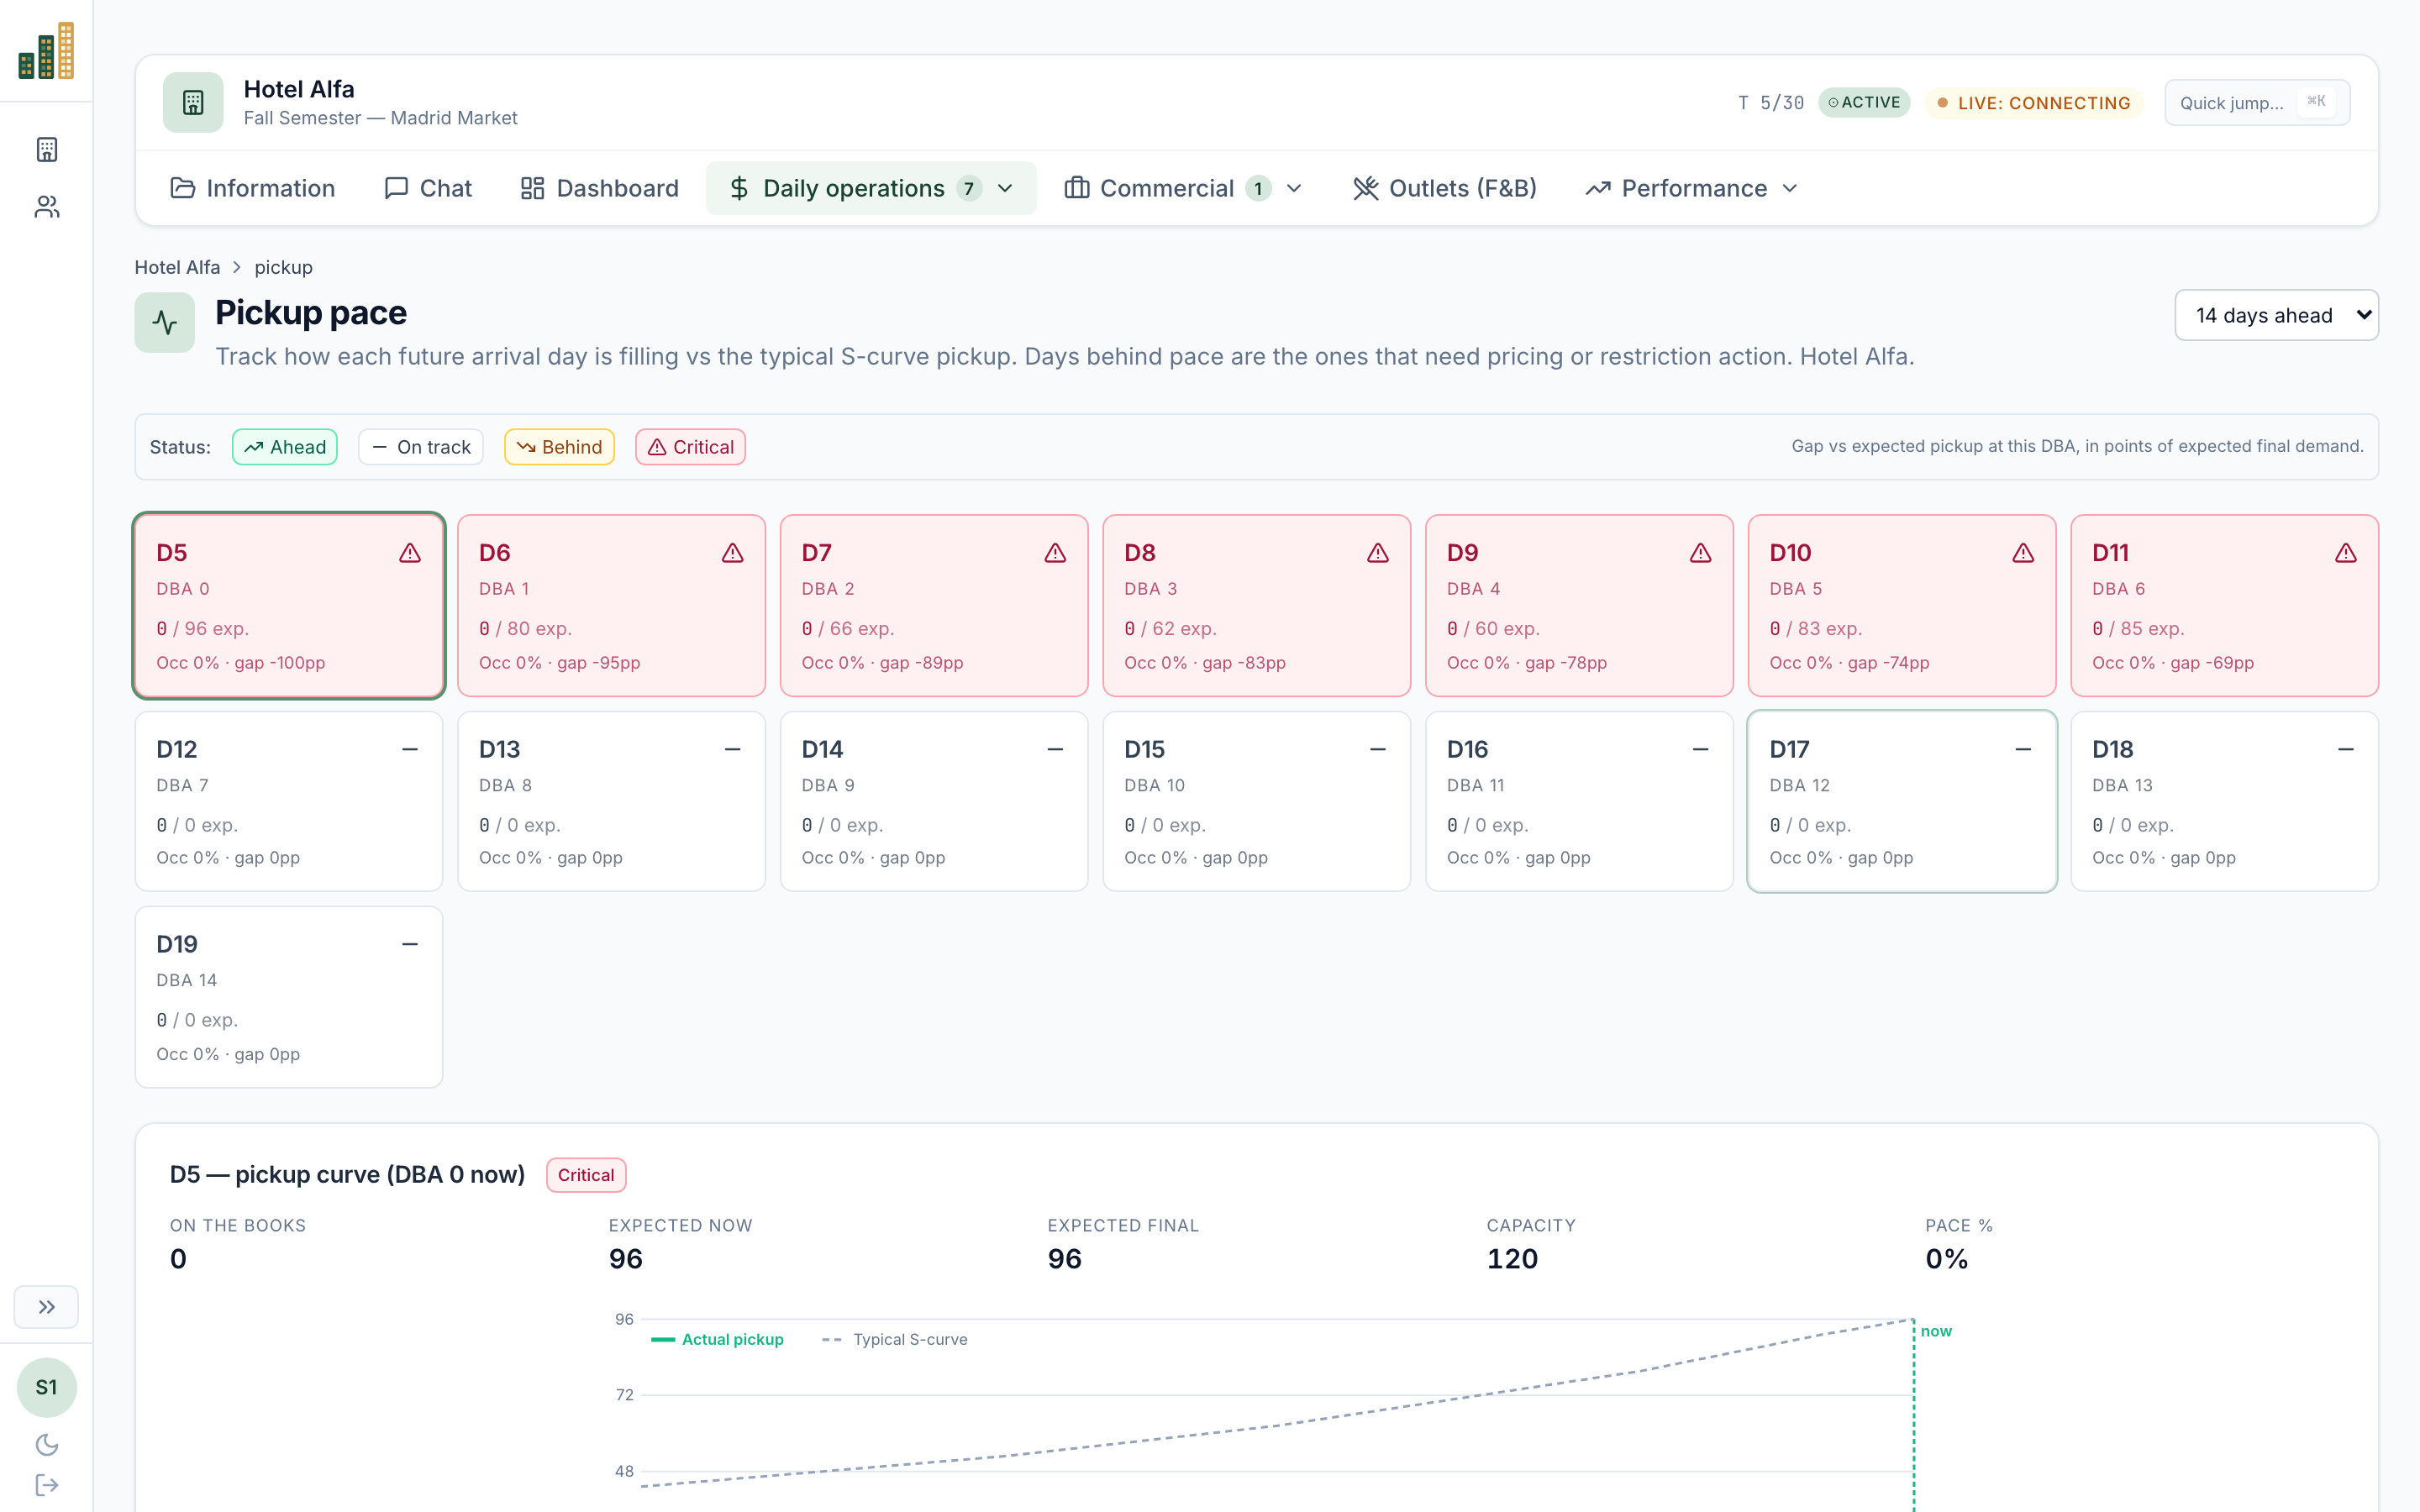
Pickup pace
The screen revenue managers open at 9 a.m.
Each future arrival day scored against the typical S curve pickup. Days behind pace are flagged immediately; the curve view explains why. Students learn to read pace deviation the way professionals do, at a glance.
- · Status per day: ahead · on track · behind · critical
- · Per day pickup curve with capacity and "now" markers
- · Configurable horizon (7 / 14 / 30 days ahead)
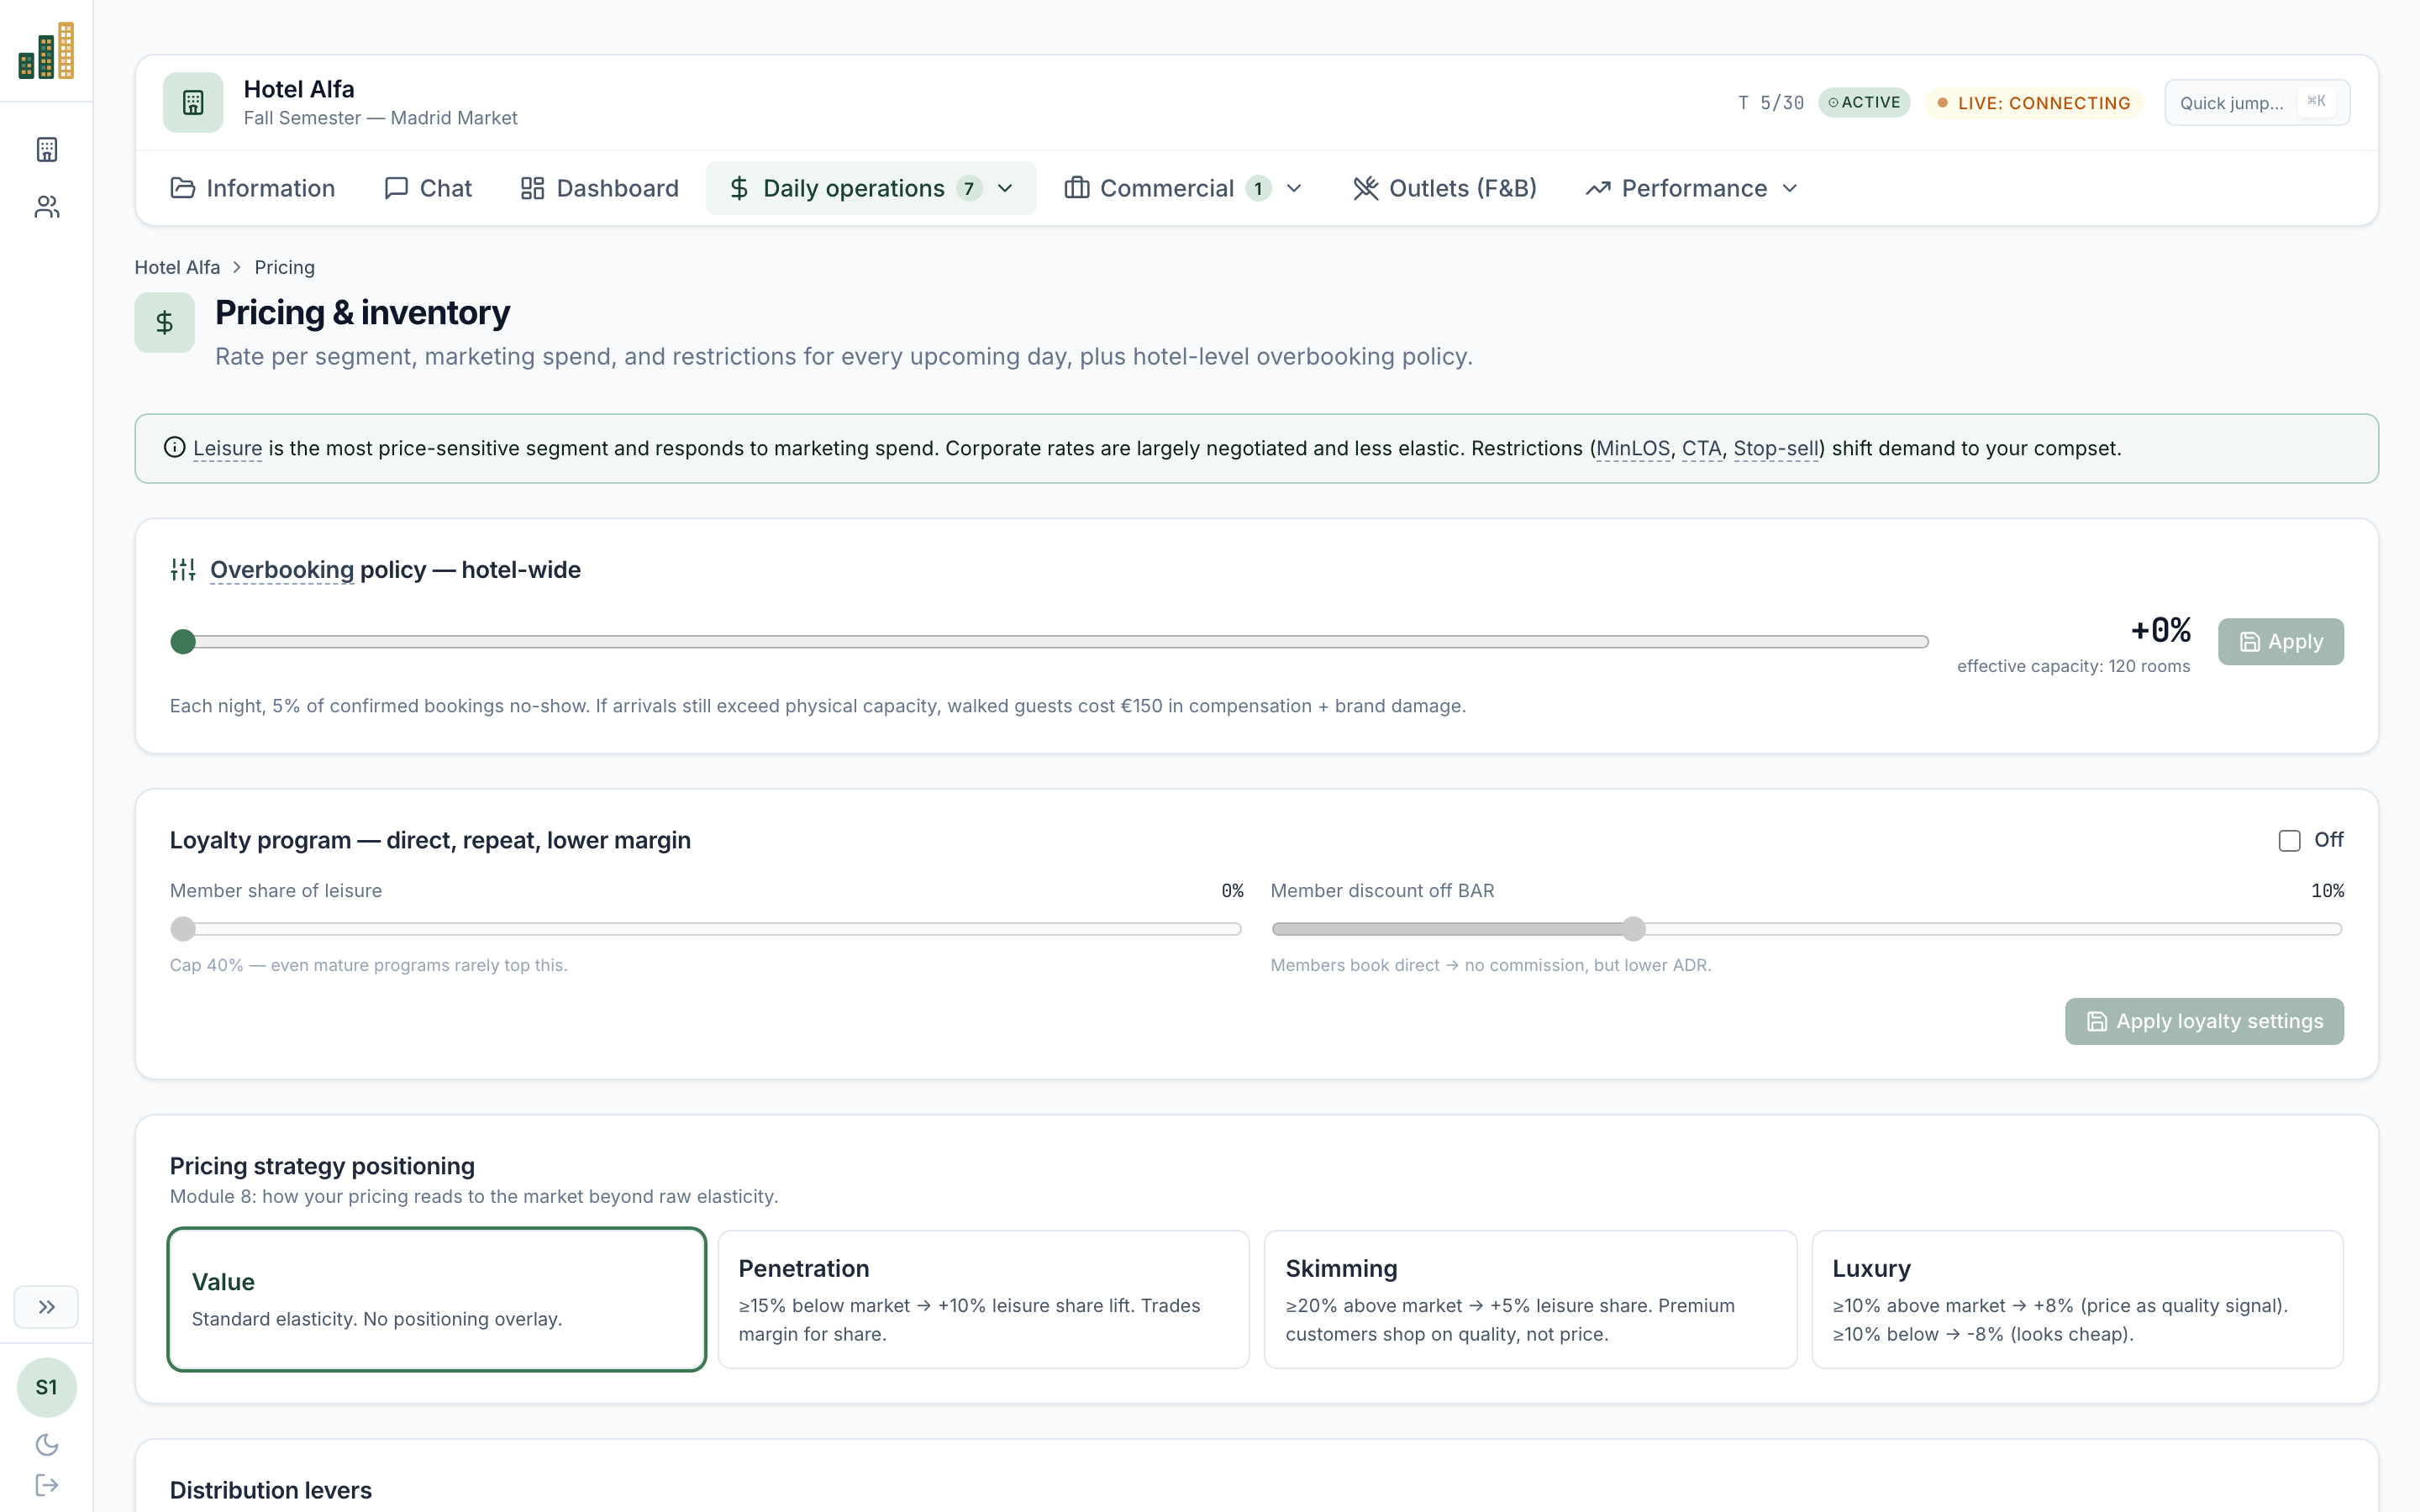
Pricing
Decisions, not just rates.
Three rate plans (BAR, NRF, AP) per segment per channel: leisure, corporate, group. Loyalty member rates. Restrictions: minimum length of stay, closed to arrival, stop sell. Quick edit for weekday vs. weekend. Every lever a real revenue desk has, exposed and explained.
- · Per segment and per channel pricing matrix
- · Stop sell, MinLOS, CTA restrictions
- · Loyalty discounts and member rate plans
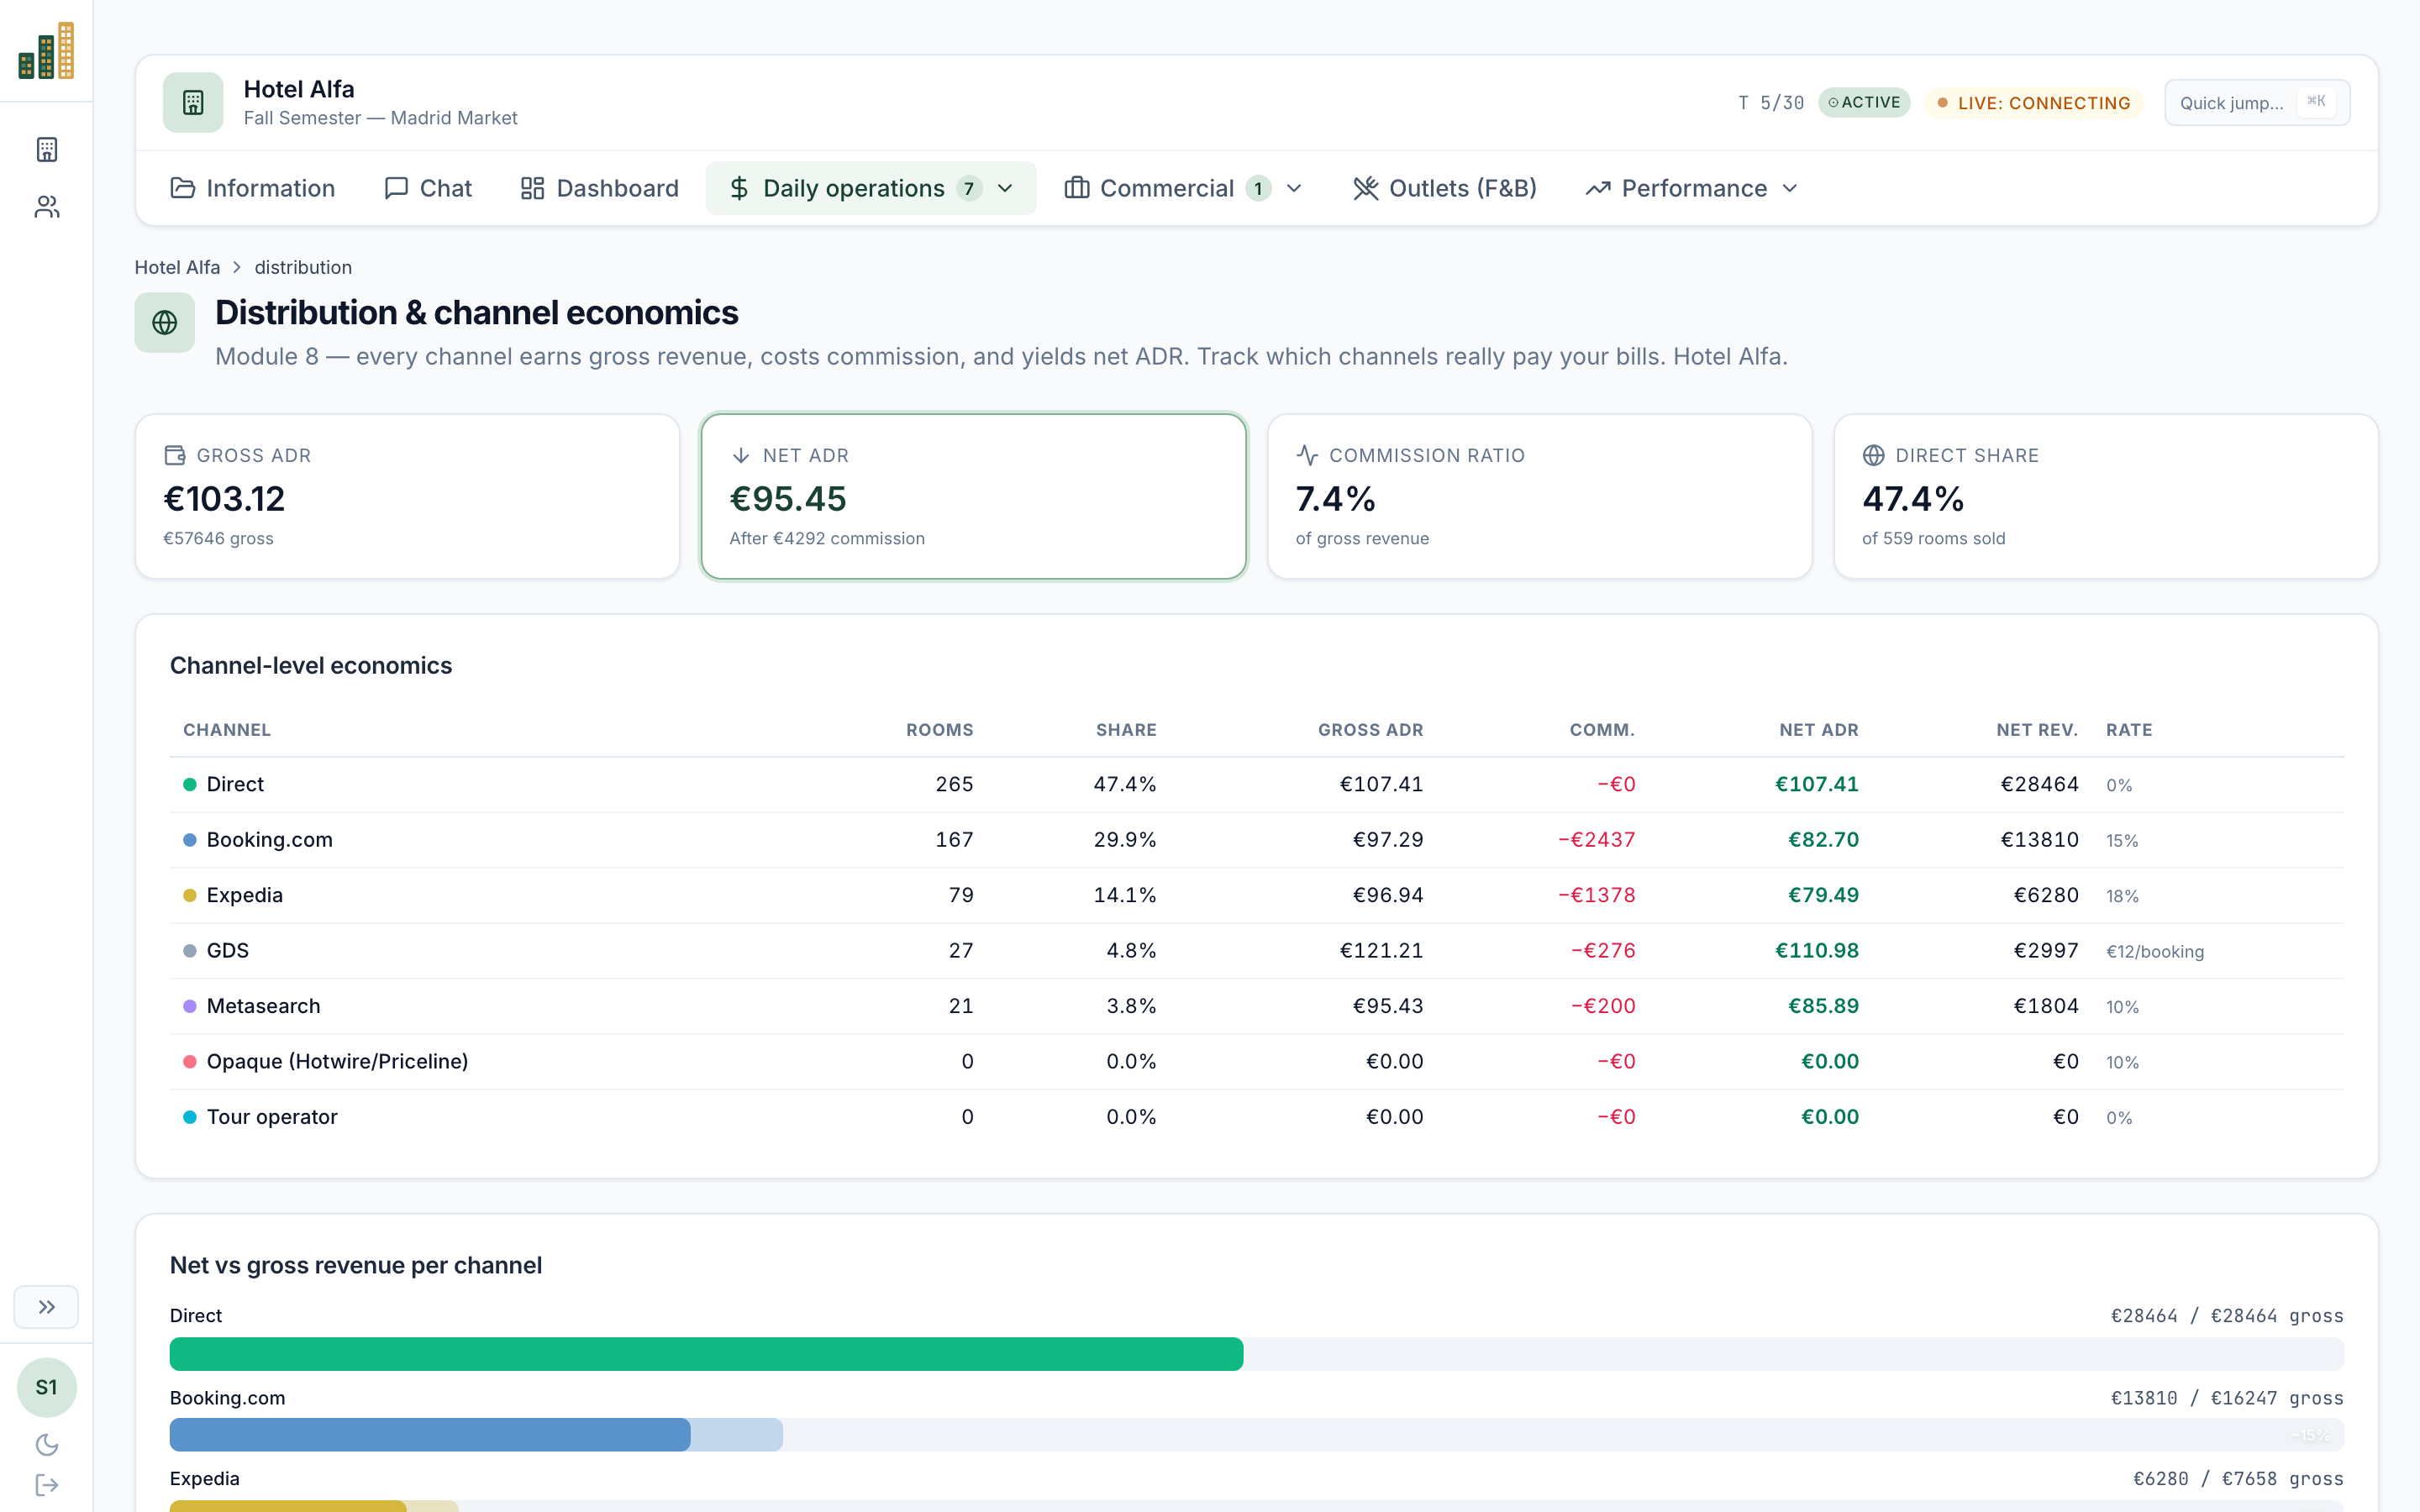
Distribution
Net ADR, not just gross.
Most simulators stop at the rate. RevLabPro models commission per channel, parity penalties, and marketing spend on each acquisition surface. Students see distribution as the discipline that decides margin, not just rate strategy.
- · Per channel commission and parity rules
- · Marketing spend by acquisition channel
- · Net ADR vs. gross ADR, the metric that pays the bills
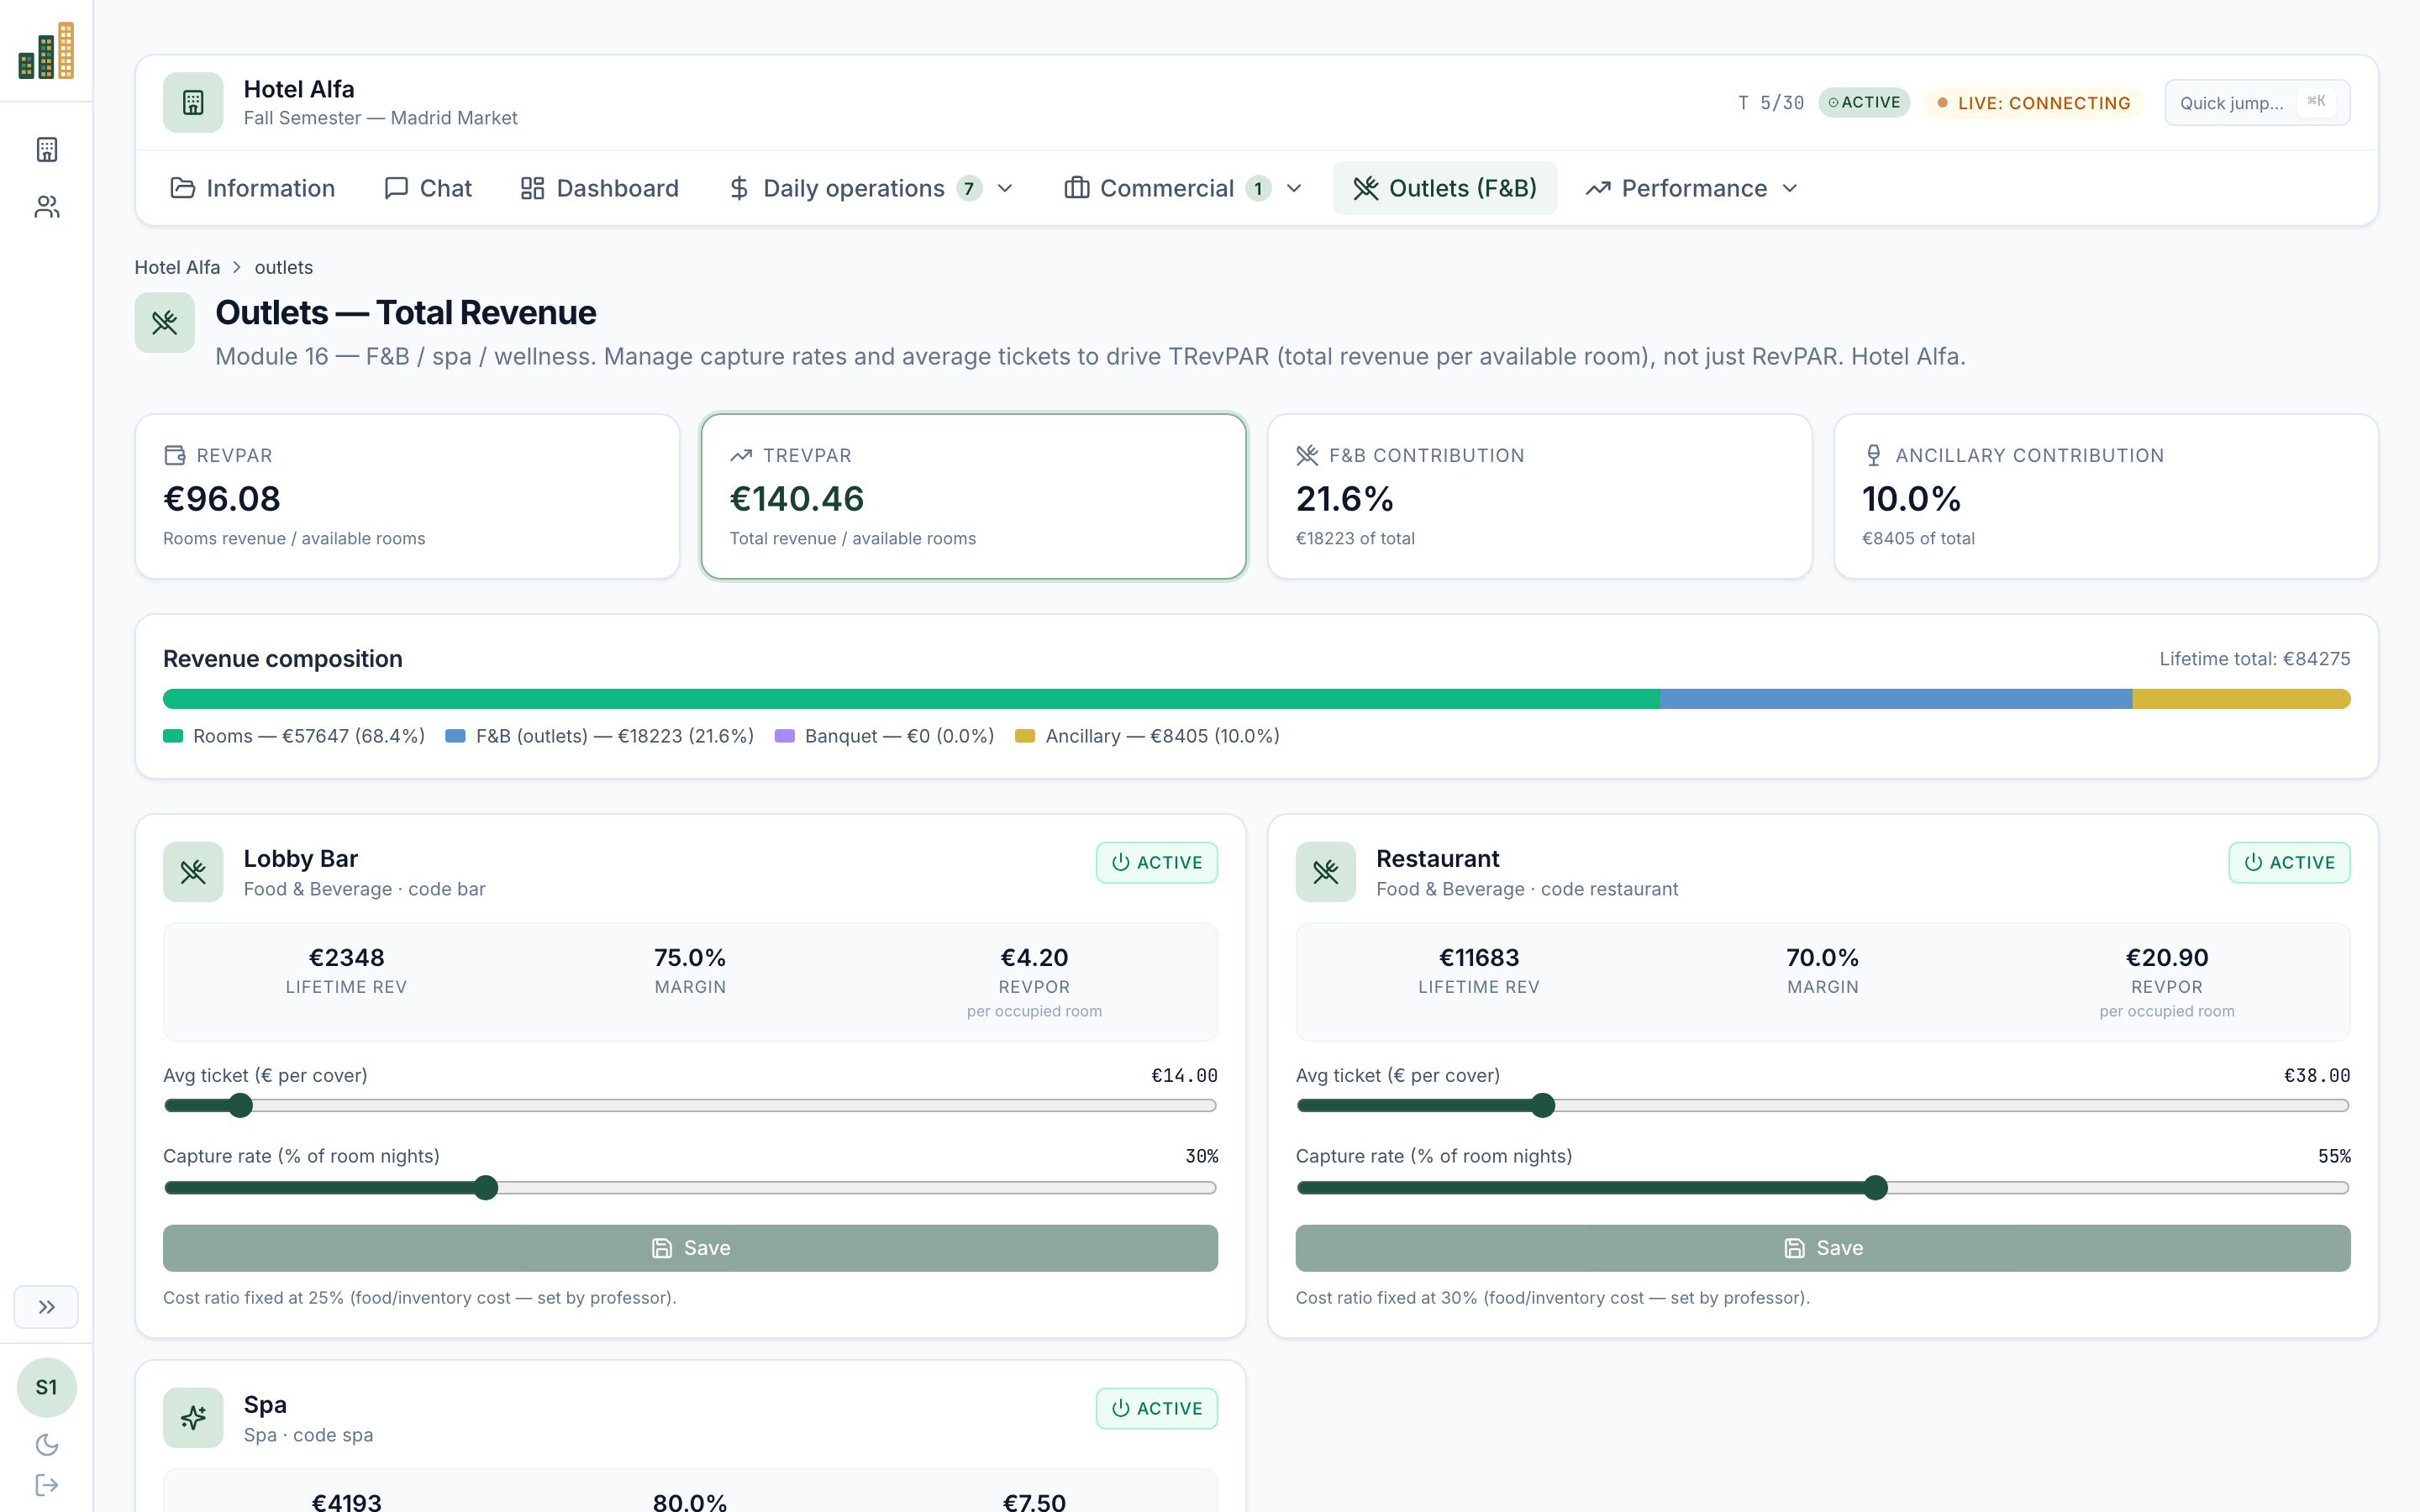
Total revenue management
Beyond rooms.
F&B outlets, spa, banquets and ancillaries, each with its own capture rate, ticket price, and contribution to TRevPAR. The student learns that the same room sold to two different guest profiles can have very different profitability.
- · F&B, spa, banquet and ancillary modules
- · TRevPAR and GOPPAR as headline KPIs
- · Capture rate × ticket price interplay
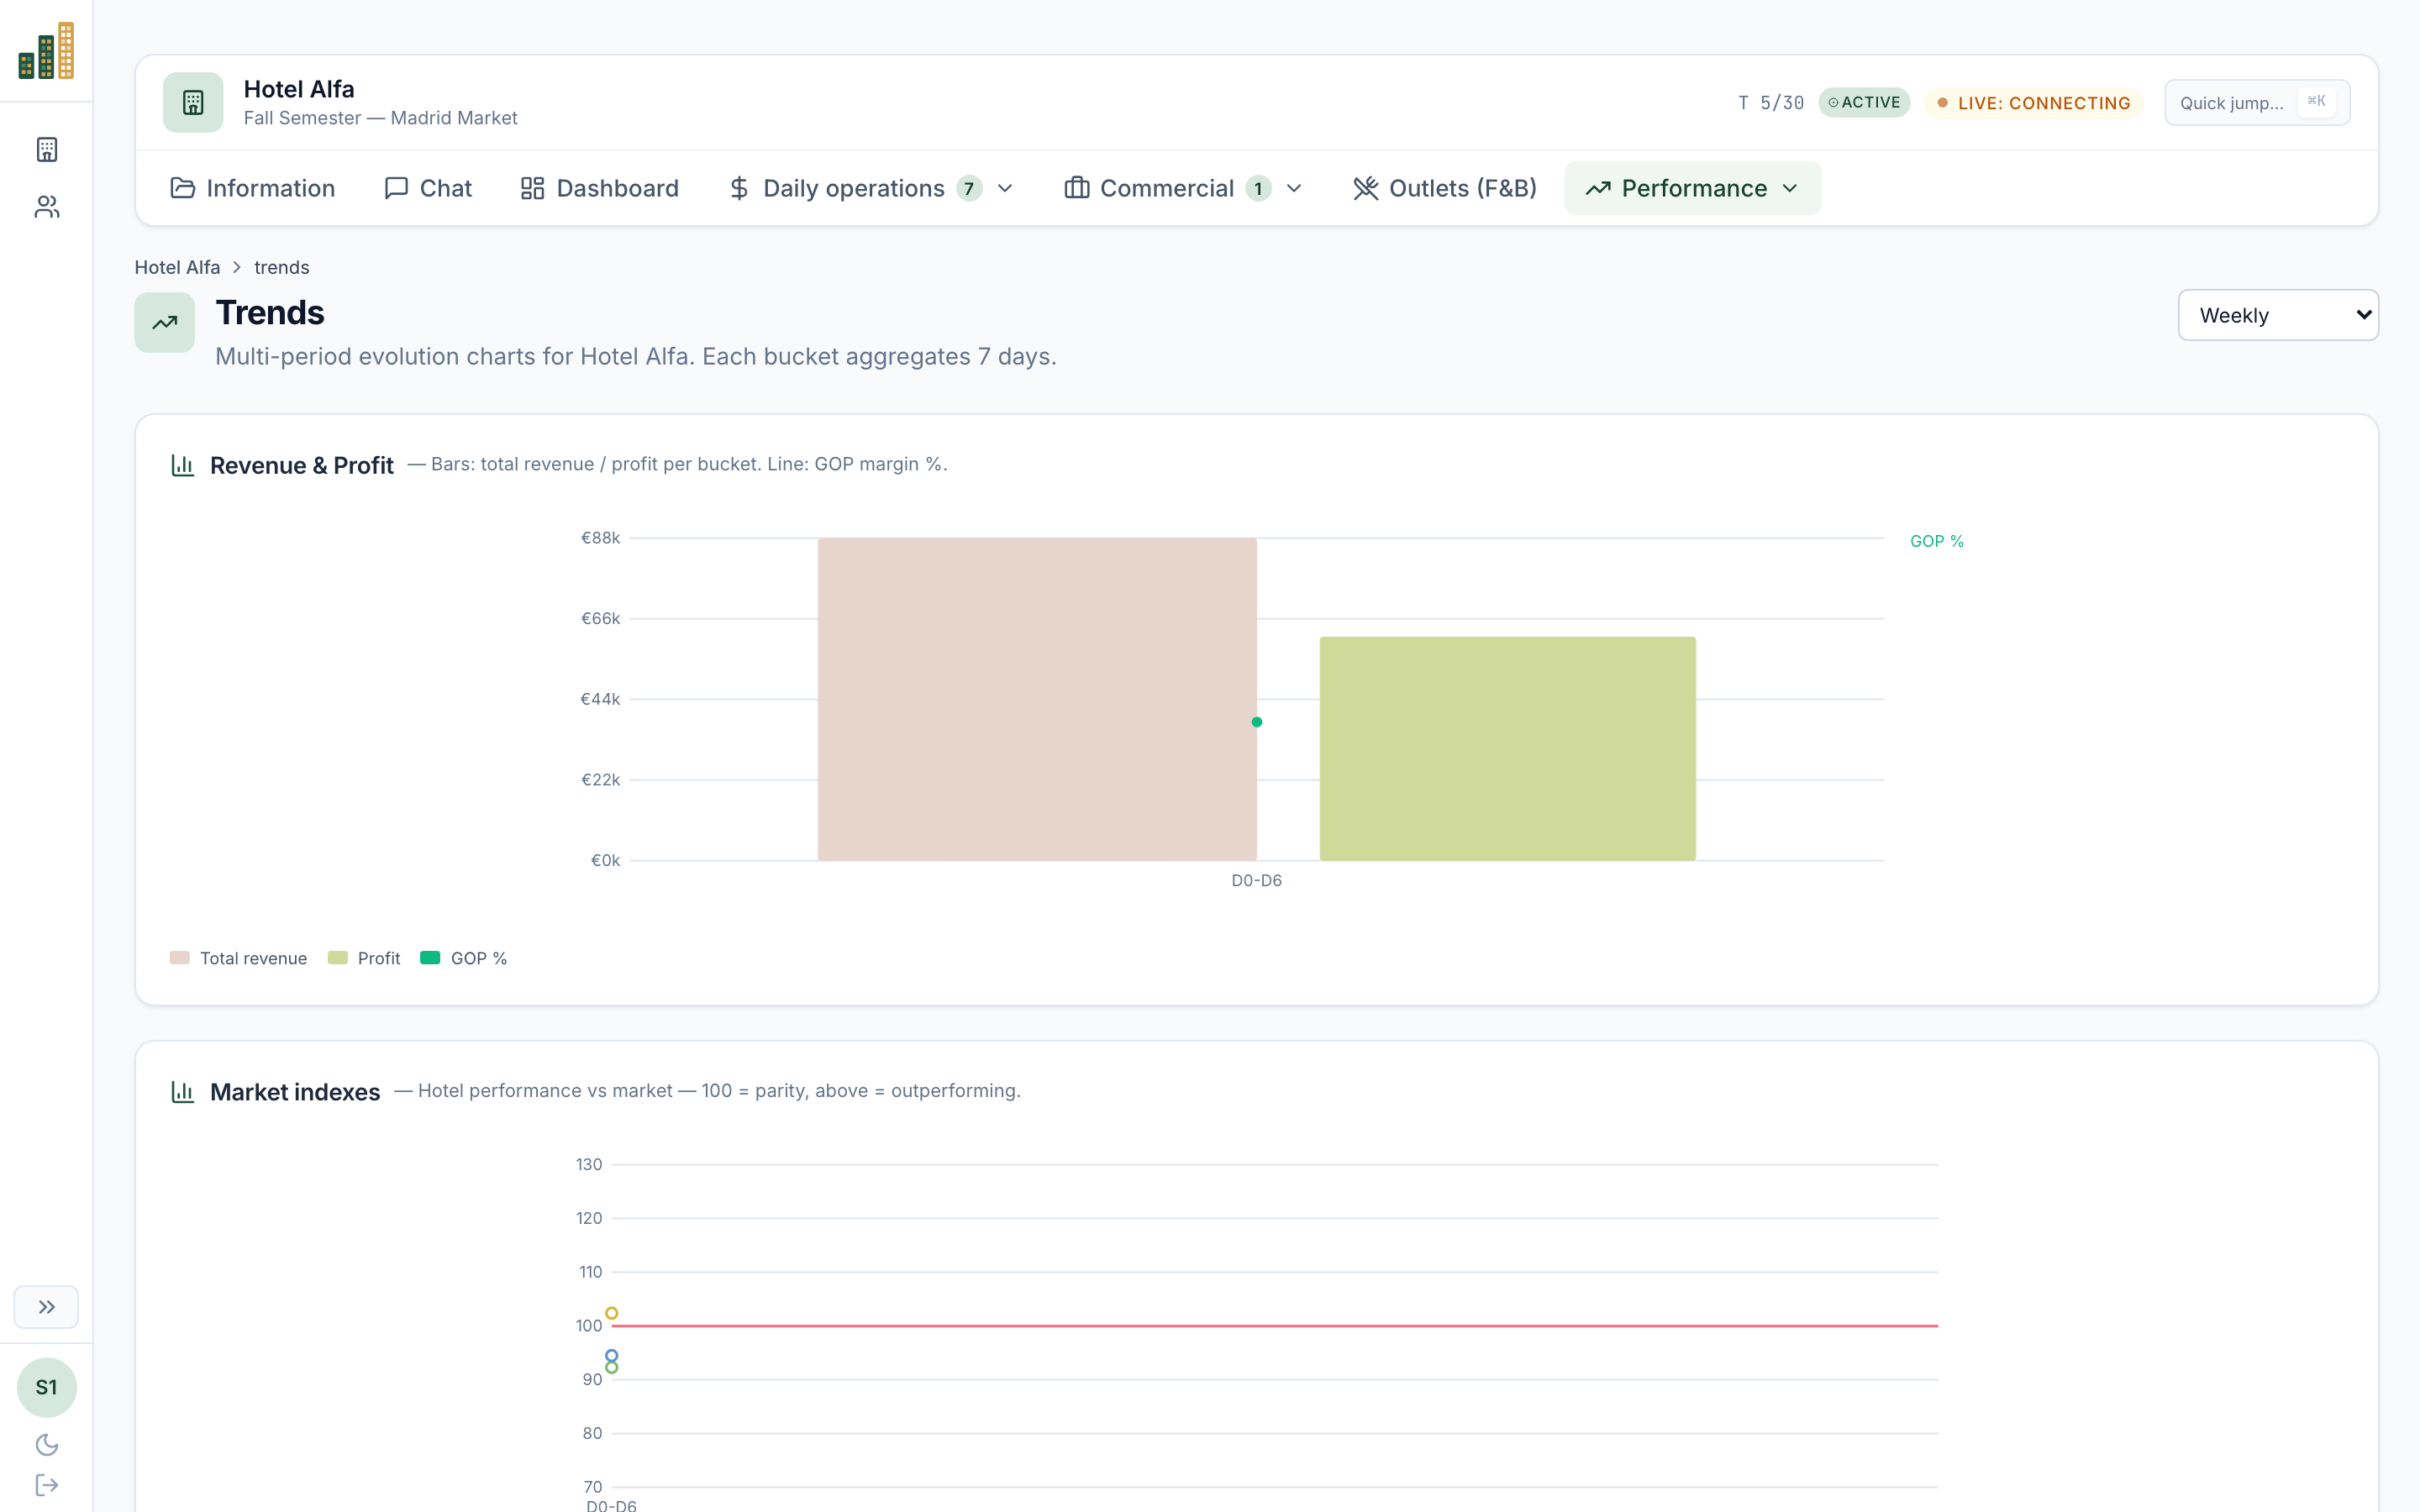
Trends
Pattern recognition by repetition.
Five charts in one screen: revenue evolution, segment mix, channel mix, market index and ADR vs. competitive set. Students stop relying on one number and start reading the shape of the business.
- · Revenue and profit trend per turn
- · Segment + channel mix evolution
- · Market index (MPI / ARI / RGI)
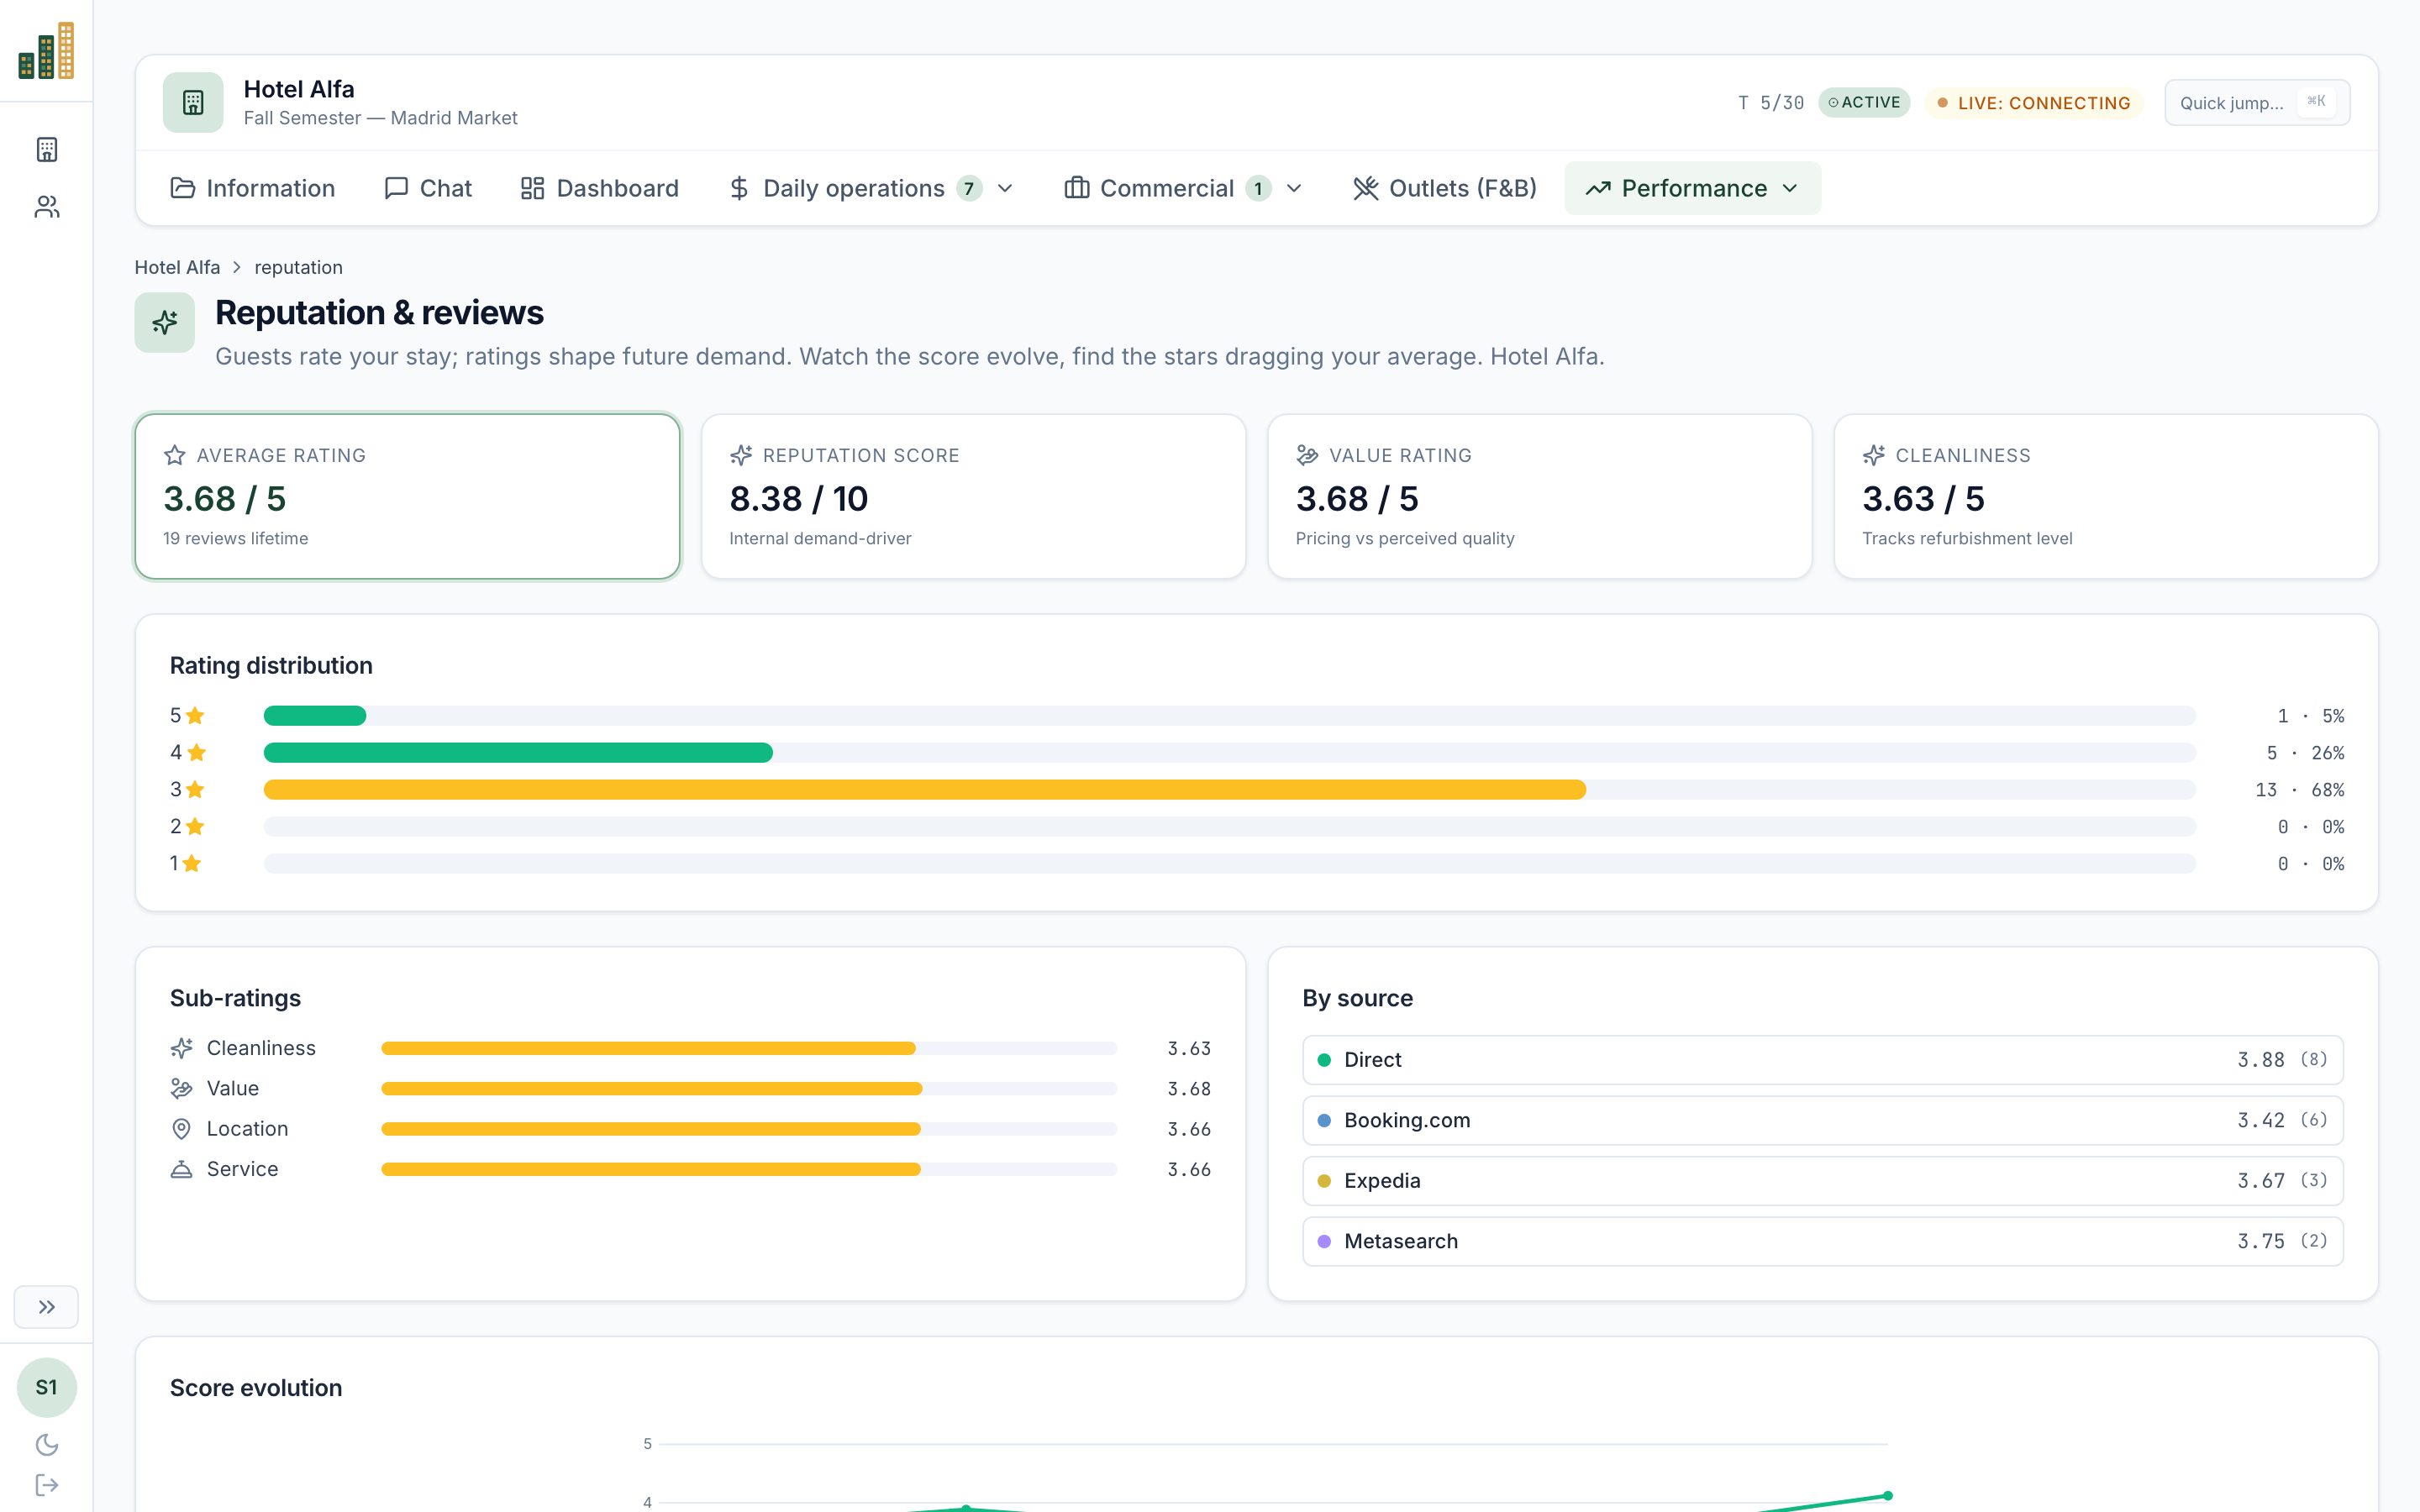
Reputation
Reviews shape the next turn.
Generated reviews from each source (Booking, Expedia, direct, metasearch) with sub ratings for cleanliness, value, location and service. The score directly modulates future demand, so the student internalizes the price vs. quality loop.
- · Reviews per source with sub ratings
- · Score evolution over time
- · Demand modulation by reputation
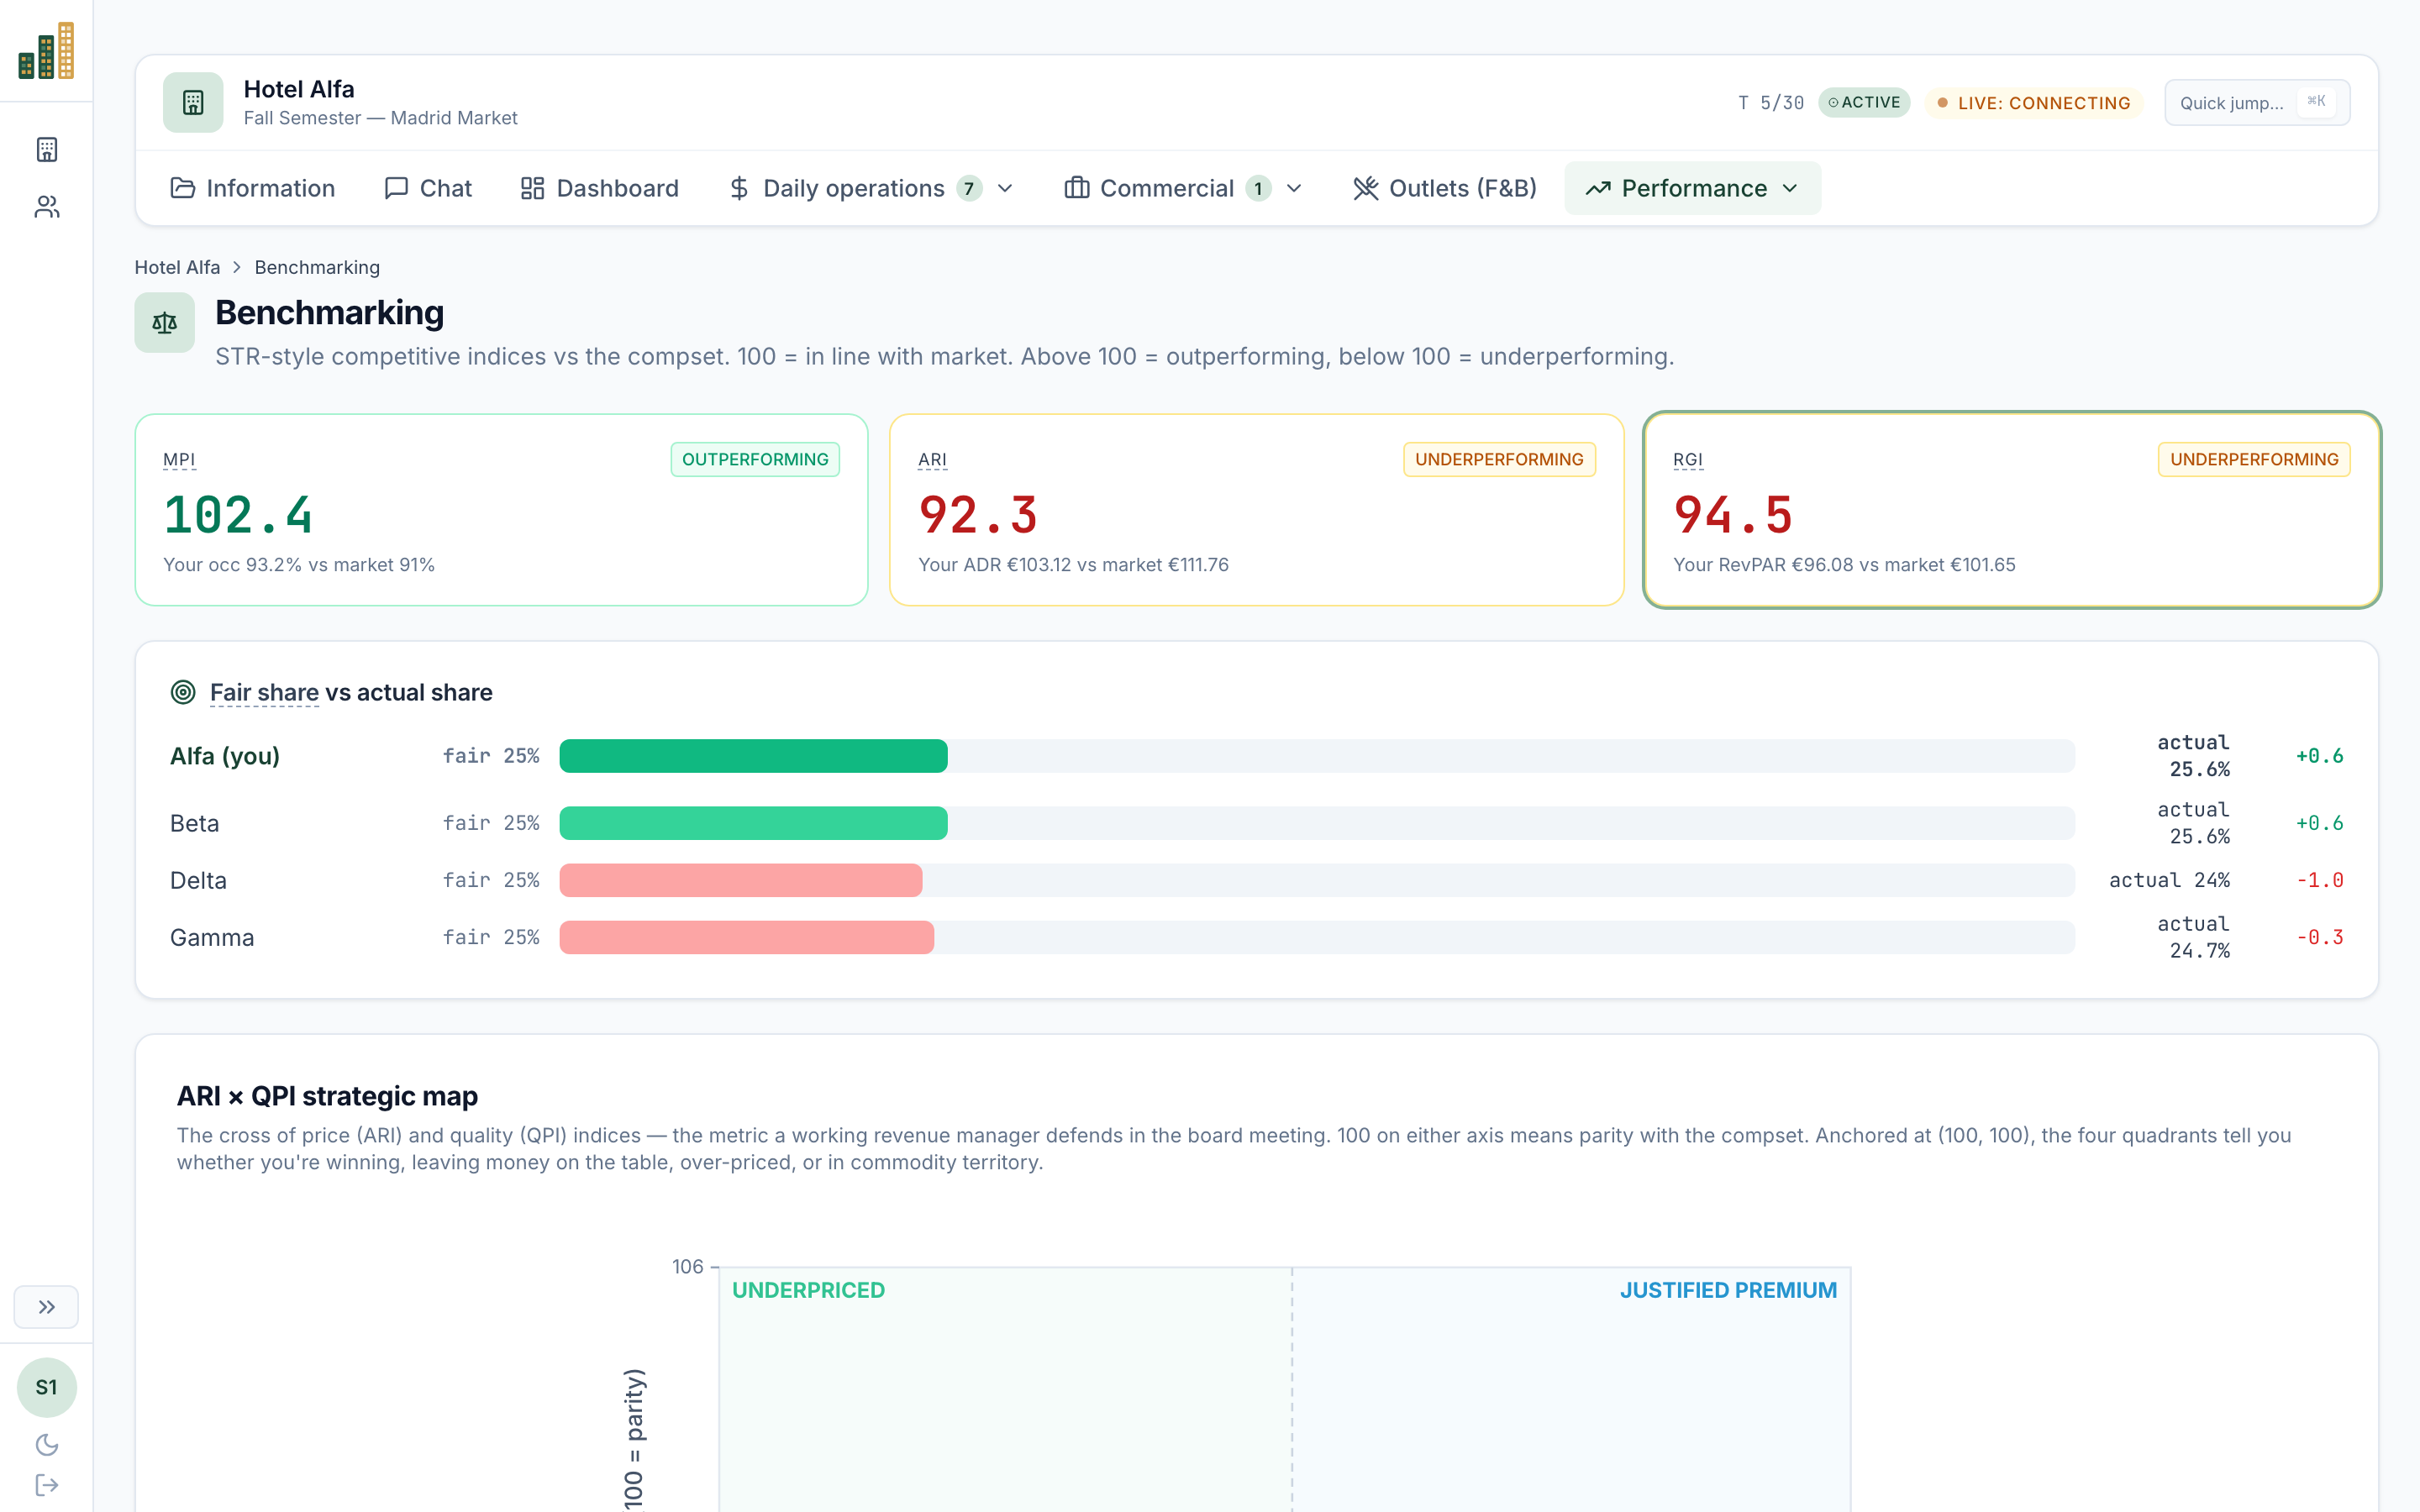
Benchmarking
Strategic positioning, visualized.
A price–value strategic map shows where each hotel sits in the competitive set, and a full MPI / ARI / RGI panel keeps the language consistent with industry benchmarking standards.
- · Price–value strategic map
- · MPI / ARI / RGI per turn
- · Comp-set defined per simulation
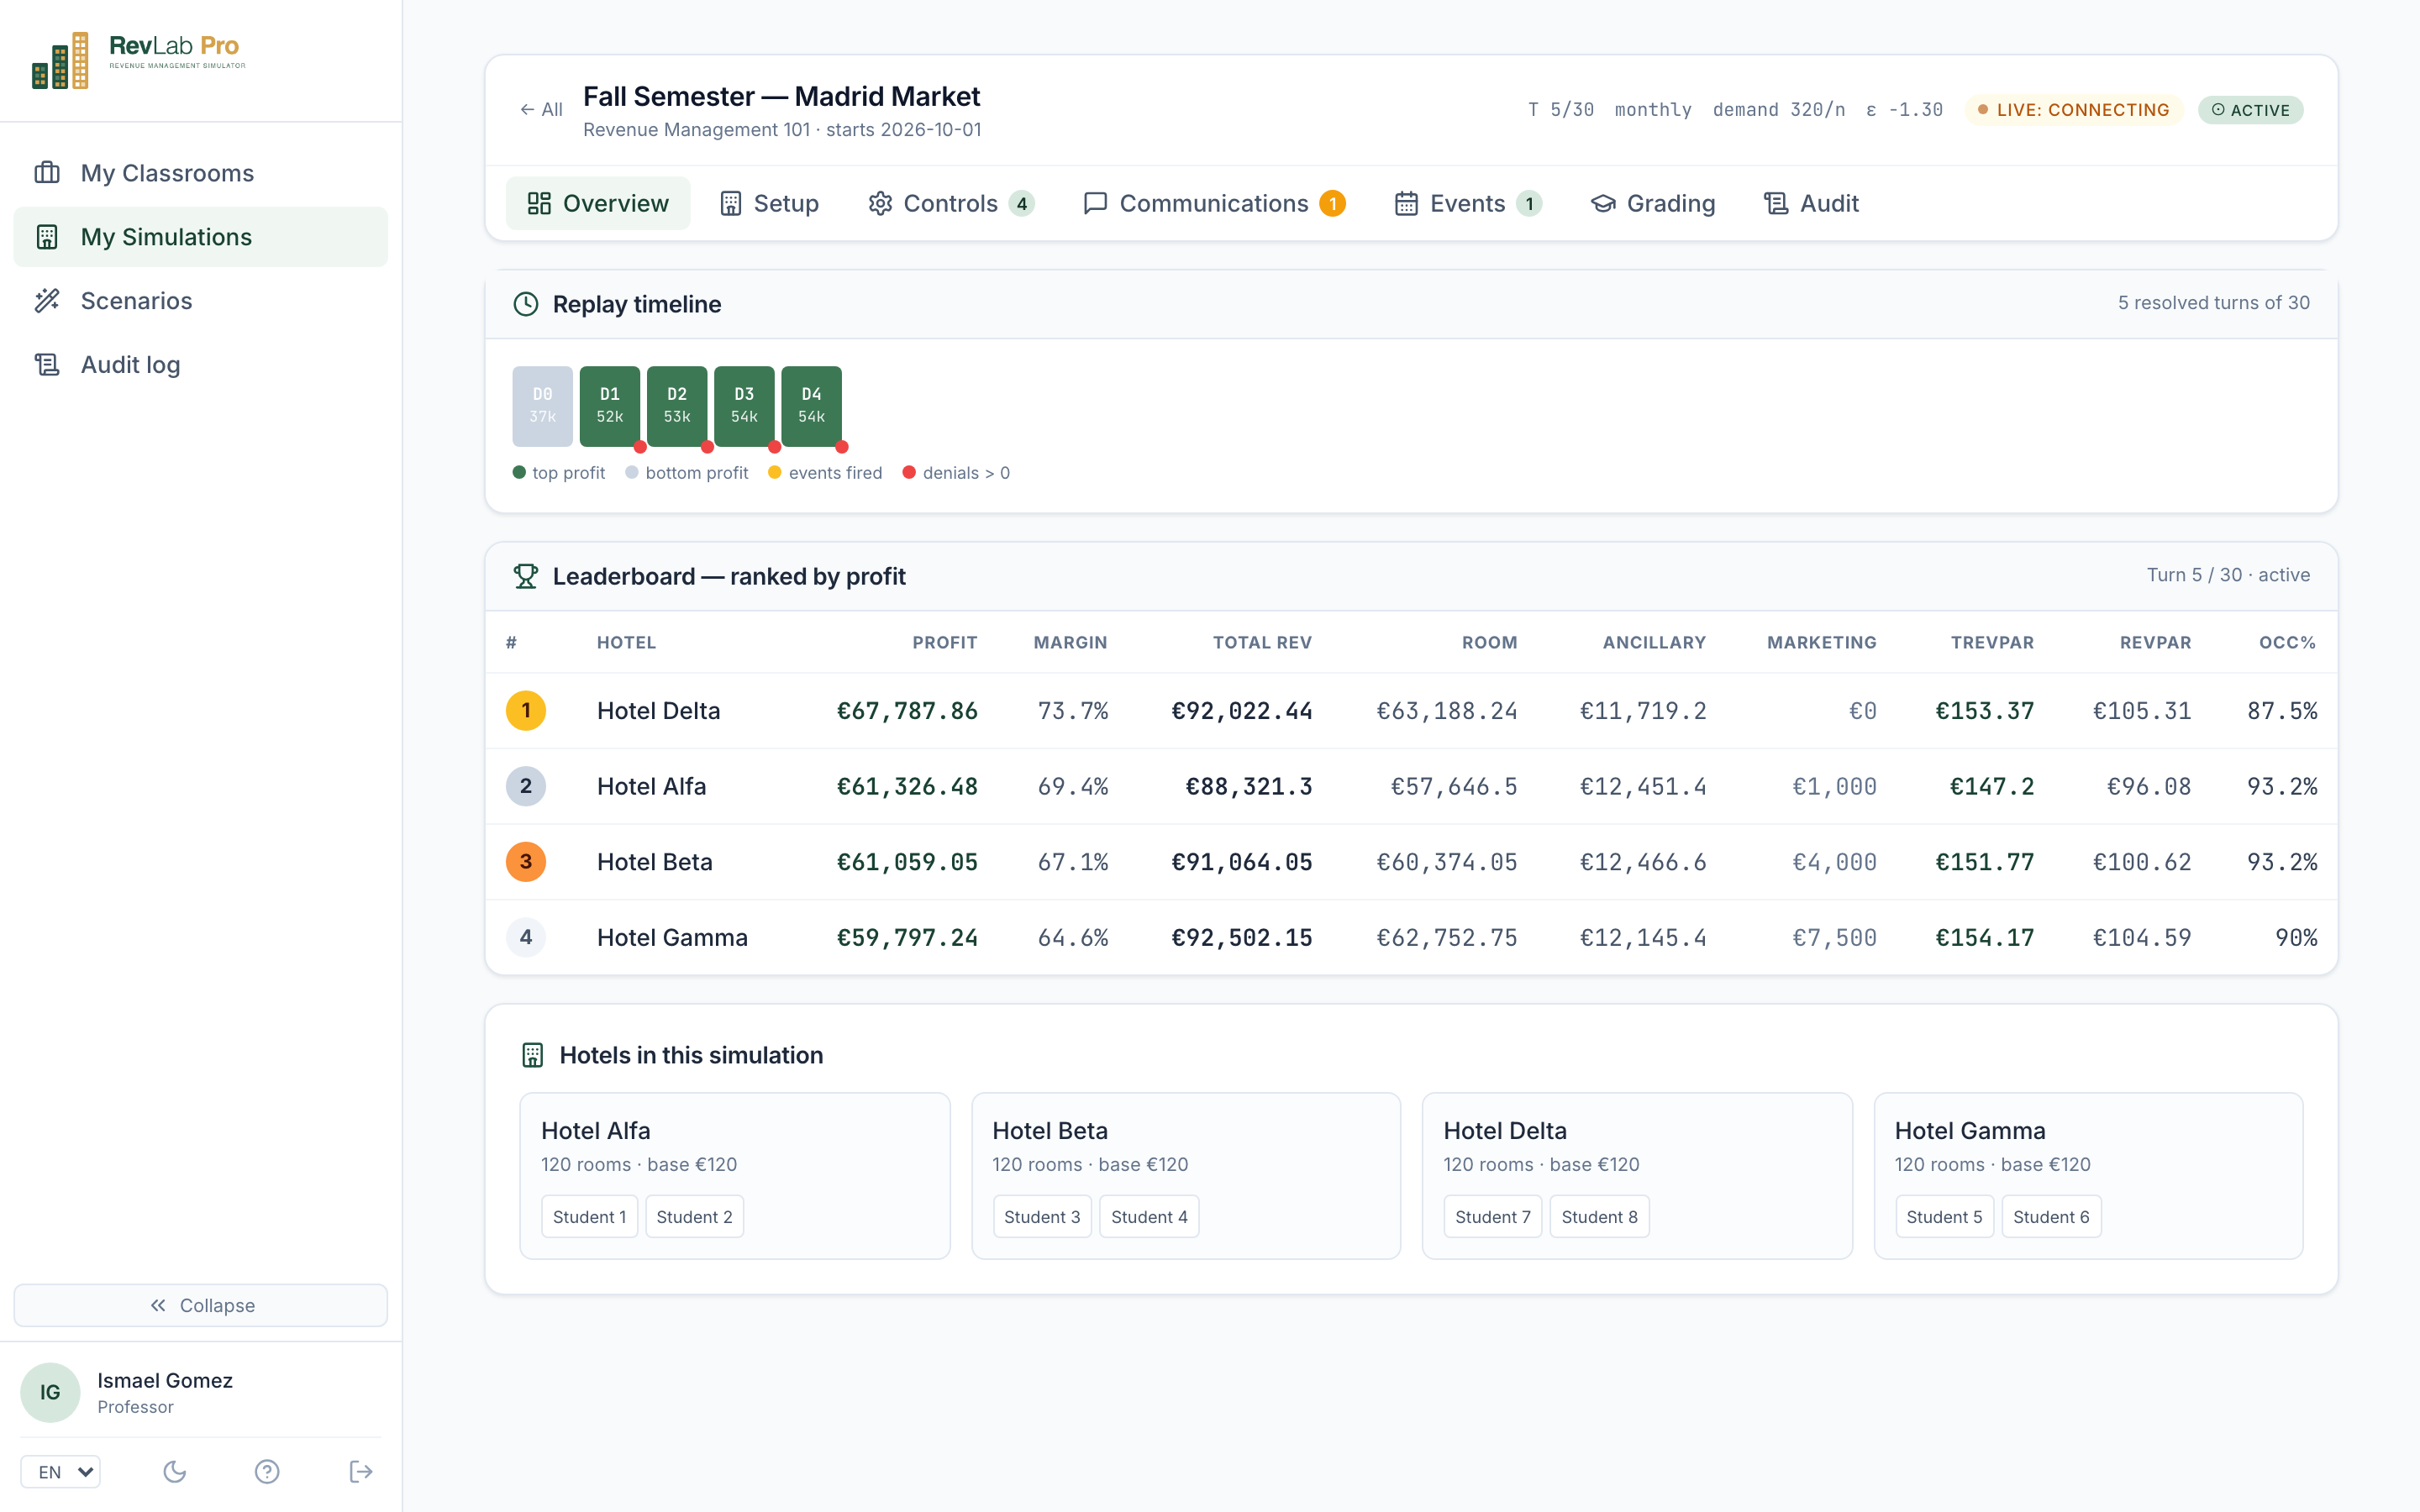
Instructor tools
The instructor view, designed by instructors.
A full overview of student progress, decision submissions, and budget tracking per team. Time controls advance one day, one week, one month or one quarter at a time. Auto-debrief generates an instructor-ready summary at the end of every turn.
- · Per-team budget and submission tracker
- · Time controls (+1 day / week / month / quarter)
- · Auto-debrief Markdown export
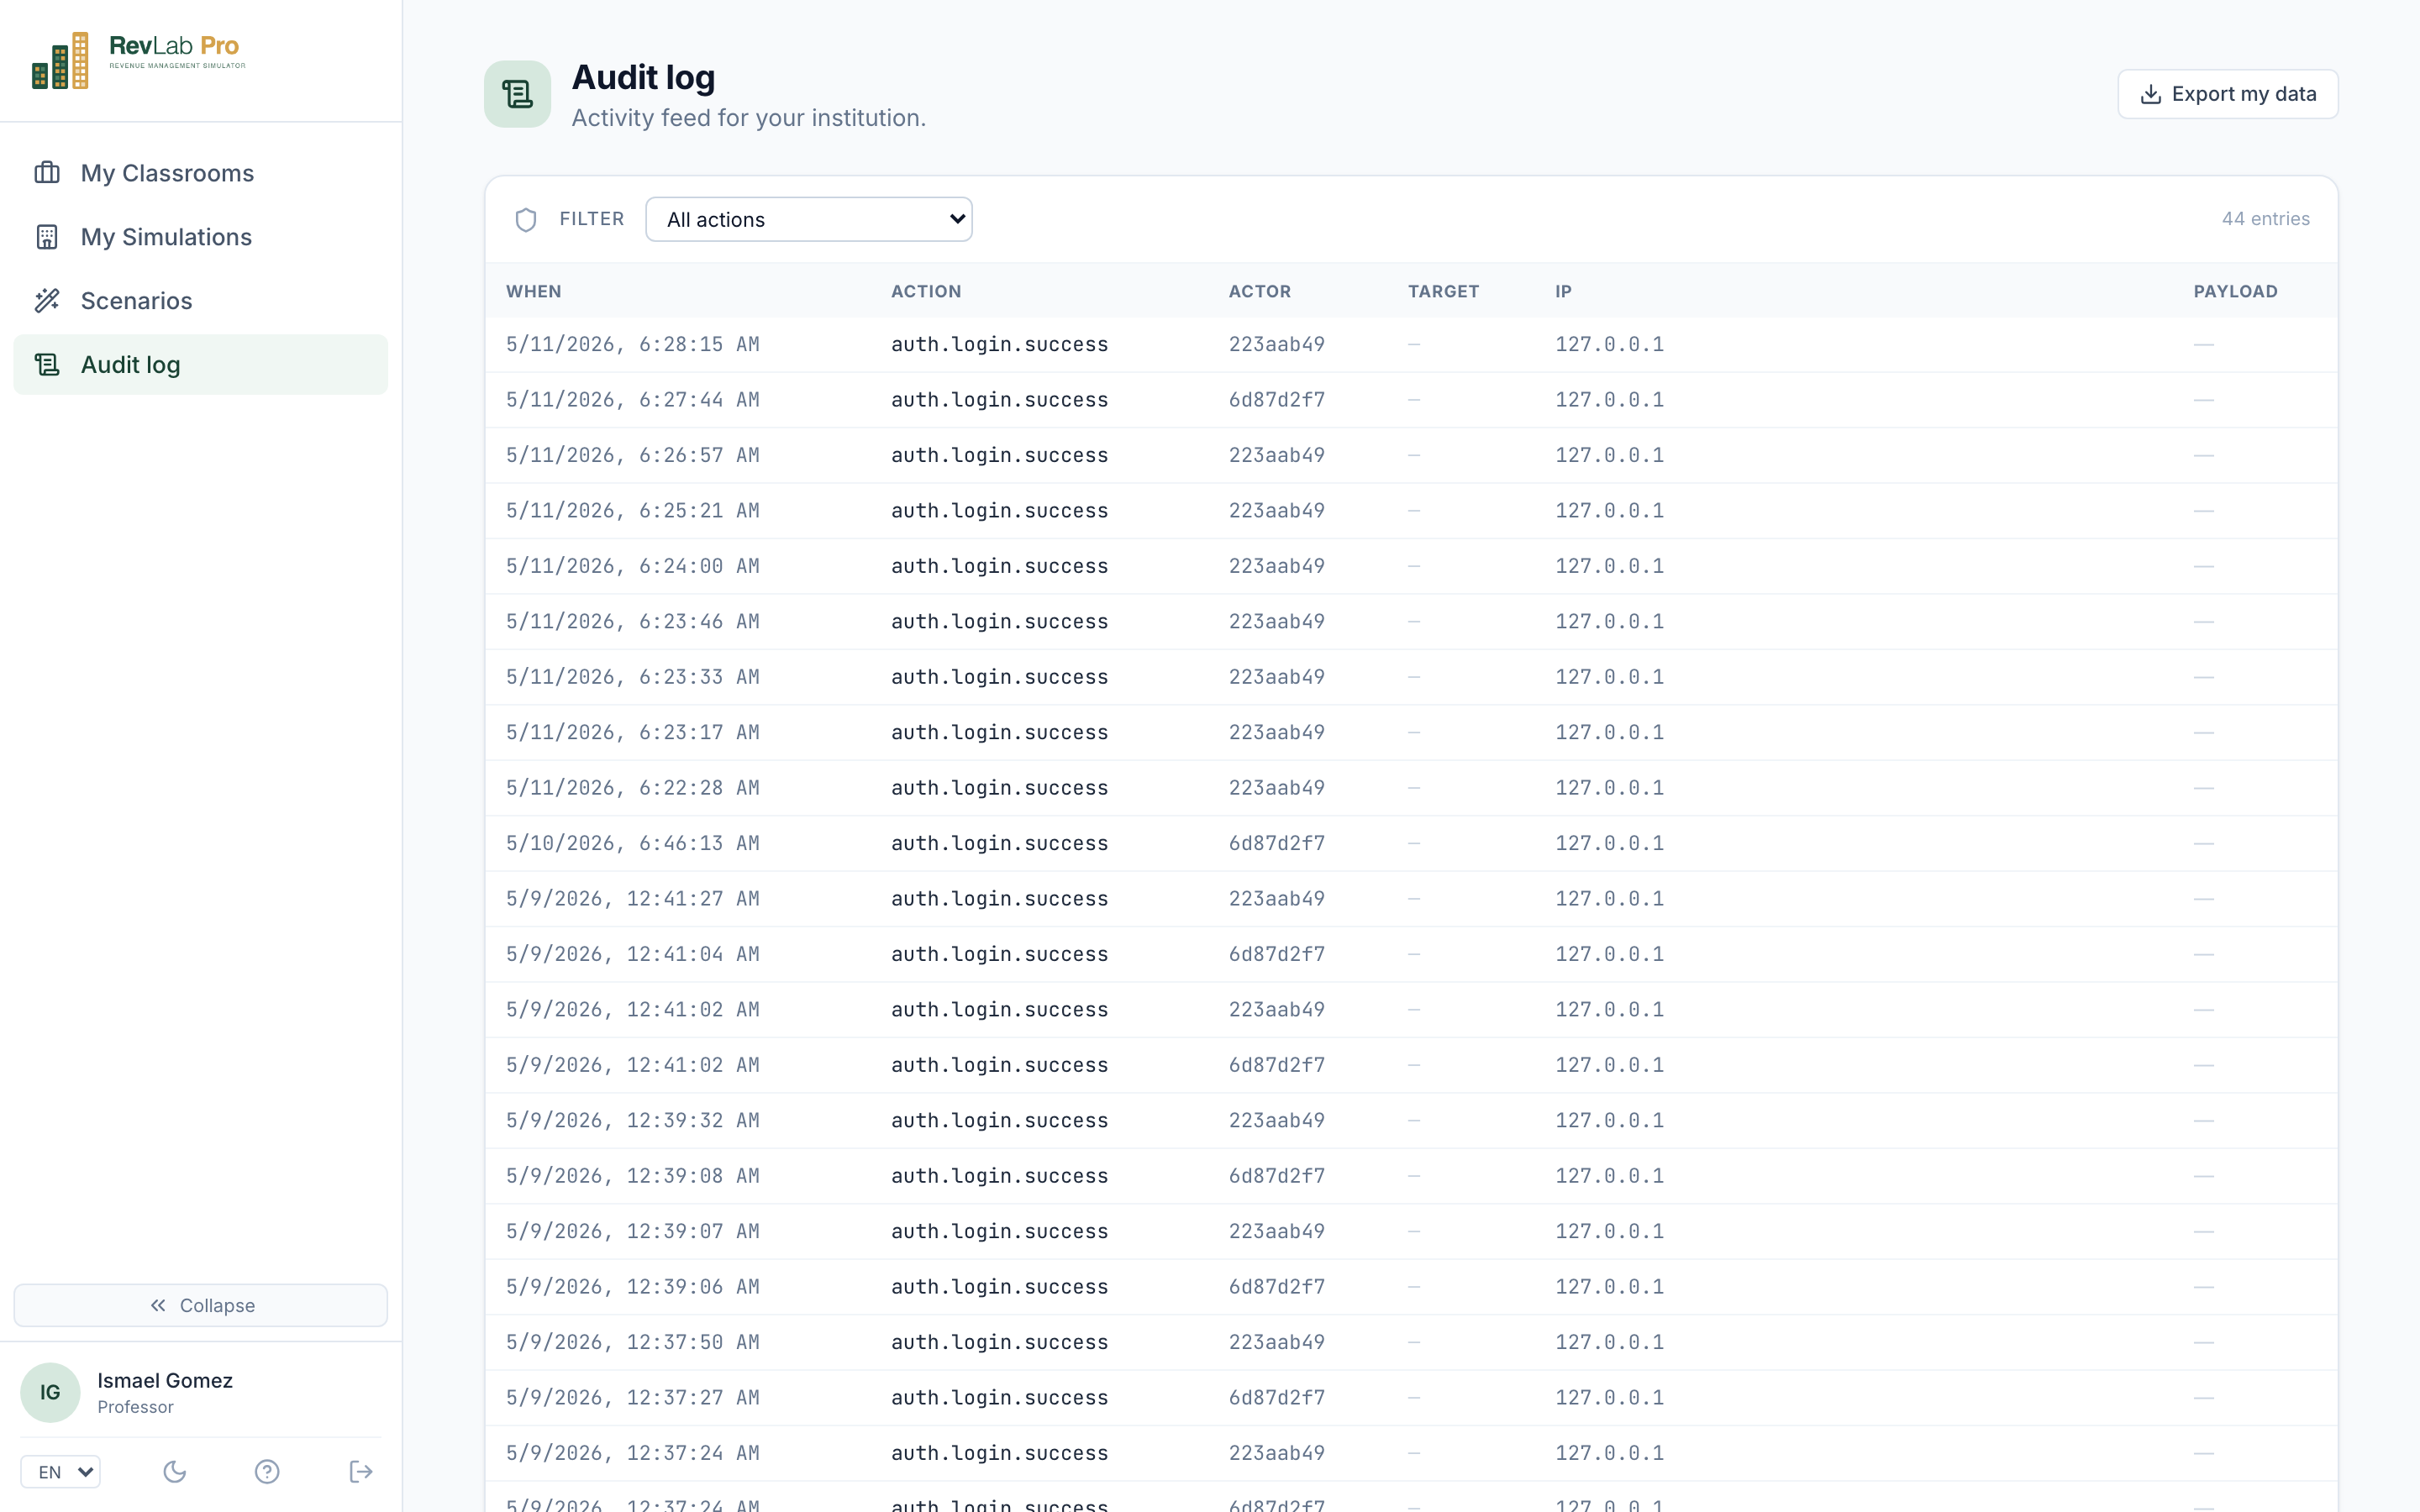
Governance
A trace of every action, for trust and accreditation.
Every decision, message, and configuration change is recorded. Filterable by role, date range and action type. Designed to satisfy AACSB academic-integrity audits and the internal compliance review of any hotel chain.
- · Filter by role, date range, action type
- · Per-user activity trail
- · GDPR-aligned data export and deletion